Treasury Volatility
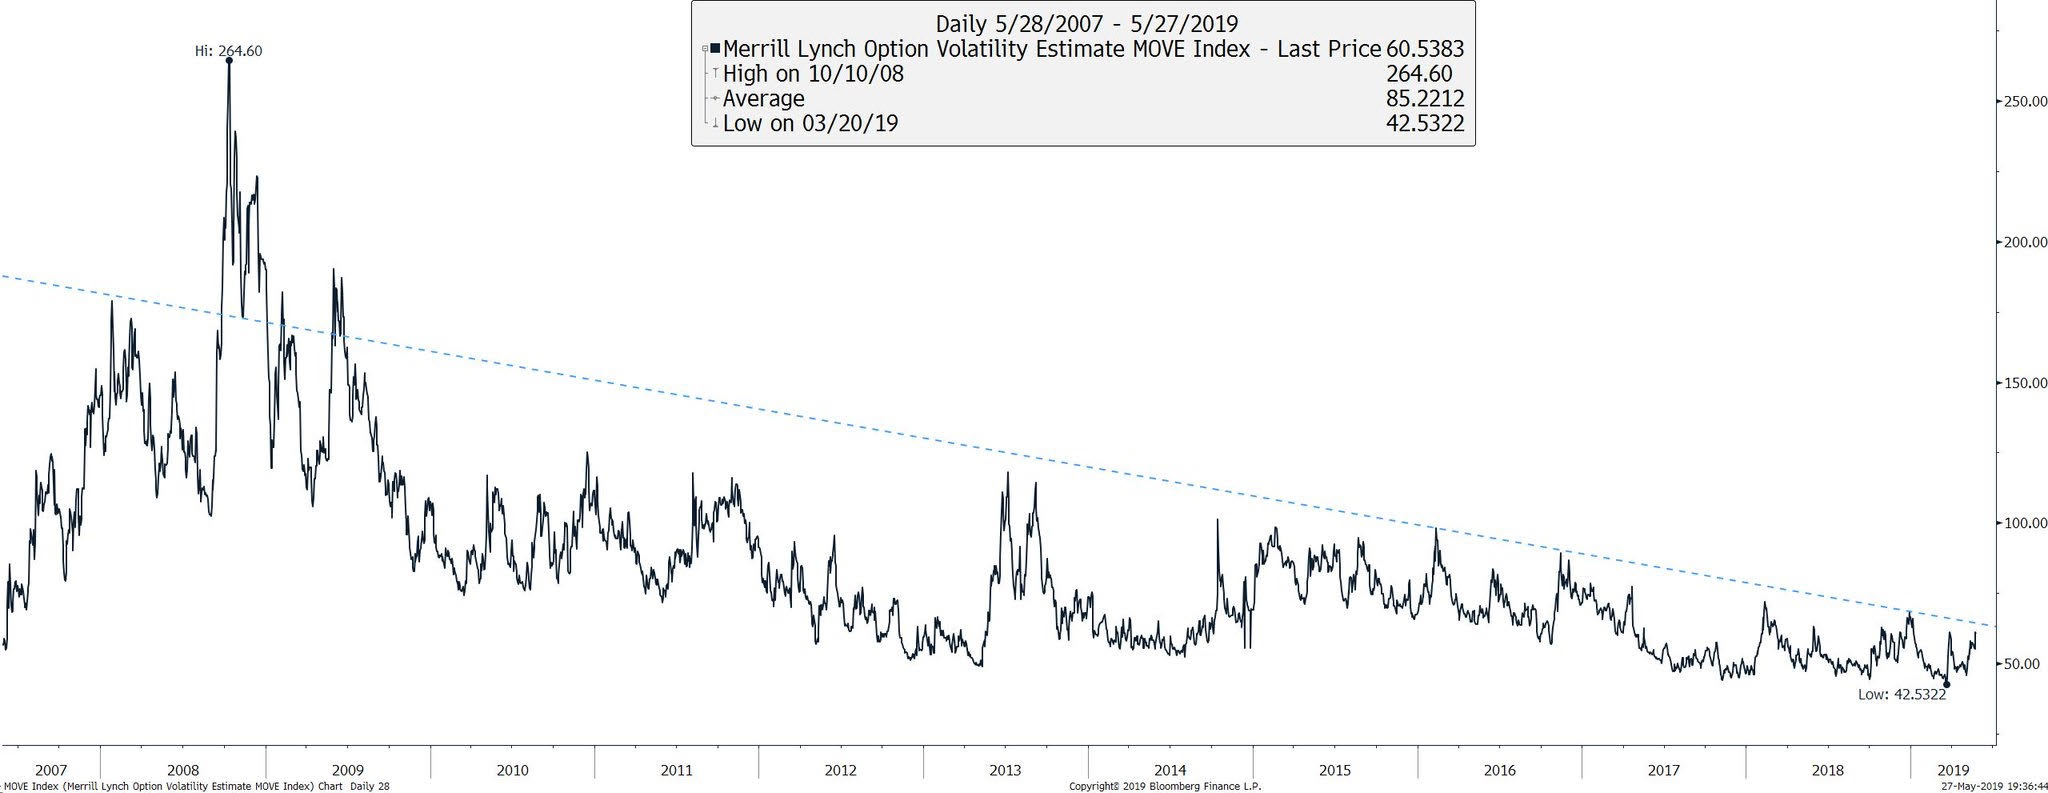
One theory I posted for it rise was based on Term Premium trading at a discount for 1st time in 50yrs and suggested that those who got caught selling volatility had to hedge by effectively going long Treasuries. Maybe this “Bond Convexity” was the reason for the recent 100bp move in the past 6 months. Whatever the reason – including risk of recession and/or future rate cuts – the index is fast approaching a trend-line test (see chart above). A break above would be quite market-moving.
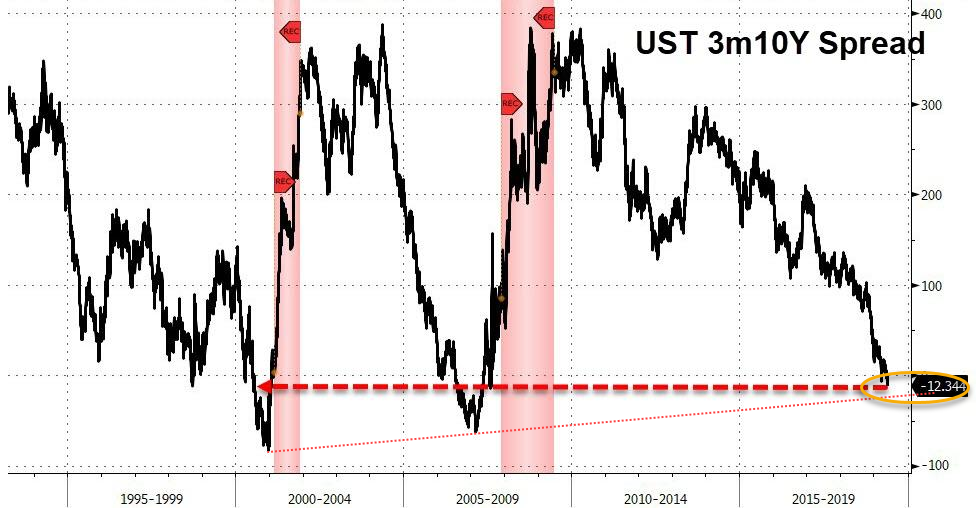
Yield Spread Inflection
On 3/27 I wrote: “Treasury Volatility caused the 10-year yields to crash which further inverted the yield curve.”
And it is the inverted yield curve, especially of the 3Mo-10Yr spread, that is causing shock waves through financial markets as bonds scream higher and equities finally pulled back after the May 5 tweet from President Donald Trump:
- Dow Jones Transports are down 9.4%
- Nasdaq is down 7.6%
- Small Caps have fallen nearly 7.7%
- SPY is down almost 6% and fallen back to it 200D
- TLT has gained 4.4% and
- The 3-month/10-year inversion currently stands at the most severe since 2007.
Judging from this chart, we are almost on support (thin red dotted line), but then this instrument needs time to consolidate before steepening.
Credit Leads Equities
These moves in yields don’t look done – neither from the above Treasury Volatility MOVE chart (breaking up) or the following descending wedge on the 10-year (breaking out). After a suitable bounce off the red trend-line, I would suspect yields fall further this summer. The bond market is intonating 10-year rates are going lower to 2.0.
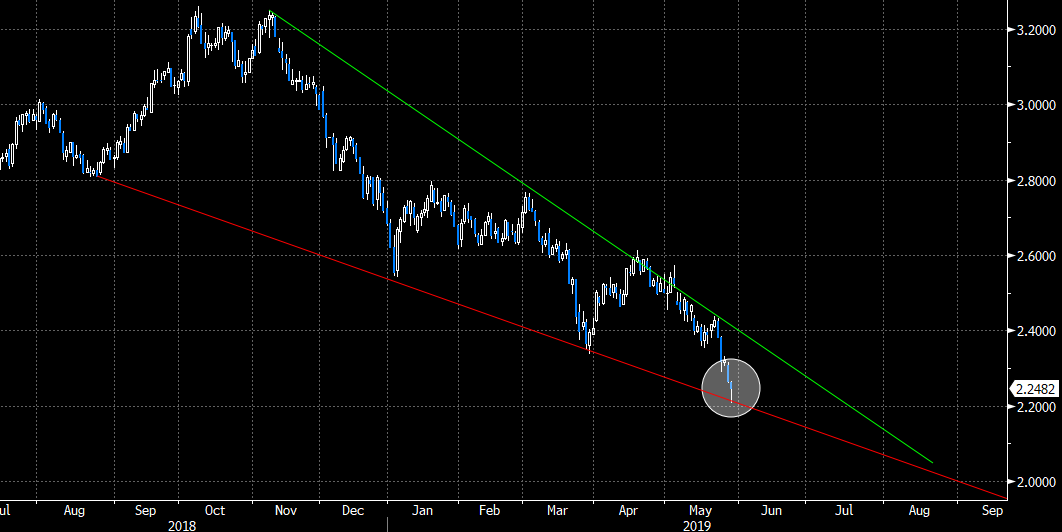
Consider this, the last time U.S. 10-year government bond yield was at these levels, 2.25%, the Fed Funds rate was HALF of current levels (1.25% in Q3 of 2017 versus 2.5% today). This disconnect between what the market judges to be the appropriate interest rate and what the Fed judges the appropriate level, is causing the dreaded yield curve inversion signal that is scaring markets. If things stay here, that’s probably good enough for a June (19) rate cut. Bryan Rich
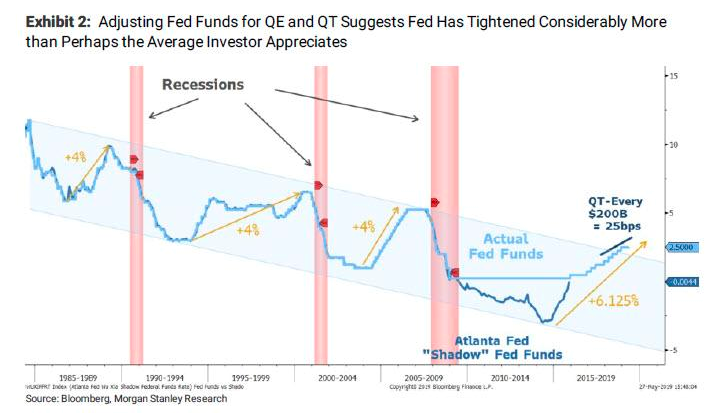
The R-Word
Here’s a friendly reminder of what can happen AFTER the Fed cuts: Recession. And judging from the ‘over-tightening’ implied (see chart below) compared to prior cycles, that may be why the bond market is aggressively leading the anticipated rate cut AND why both bond and equity markets are interpreting it as recessionary.