My mantra is simple and what drives my Macro-To-Micro trading style: Policies lead the economy. Credit leads equities. And Volatility reprices everything.
My Gone Fishing Newsletter is divided into three parts:
- Reflections and Inflections
- Sector Watch
- Macro Considerations
Reflections and Inflections
I believe we are on the verge of rolling over soon as we are reaching a bullish sentiment extreme. It may take $2920~ $SPX before we do, but we are close. I allude to that in my weekend newsletter – Intermarket Chart Attack: Shorting – is mother’s milk to me – because I think it’s nearly time. Having said that, most of this article postures with the Bull’s Case for higher. I wanted to be fair and present it before anyone dismisses my technical analysis as not macro- or fundamentally rigorous enough. No, I get the Macro and Fundamental and Intermarket and Sentiment pieces. I also see Details that tell a story from the Divergences and that’s how I feel I can make such bold calls like I did in A Prediction Come True: Then and Now
I have also made a micro market timing call in The Weak Ahead that it wouldn’t surprise me if we have a down 3% SPY day this week followed by a big rise in stocks soon after to create the buying capitulation and sentiment extreme needed, even by acquiescing bears, to create the sharp reversal, followed by another 20% correction or even a flash crash.
Until my thesis is disproved, I am trying to stay agnostic – a situational bull or bear – just in case the euphoria phase takes off with new Energy 😉
Sector Watch
We have already seen rotation from Cyclicals (e.g. bank stocks) into Tech. Big Tech into Unicorns. Defensives have also outperformed ( e.g. utilities, REITs) while previously high-flying Healthcare hasn’t. One area still deciding is Energy. I wrote about this – good and bad – in these posts:
Bullish Themes to Watch: Energy, Value, Home-builders
Commodities at an Inflection Point
Macro Matters
So Many Tailwinds…
We just wrapped up the strongest Q1 in 20 years, followed by a week of more gains: the S&P 500 gained 2.1%, the Dow rose 1.5% and the Nasdaq jumped 2.7% on Friday the 5th. On top of that, April has been the strongest month of the year over the past 30 years. Even Bears are getting on the band wagon! What could go wrong?!
Credit markets seem to be confirming the equity market advance – the price performance of high yield, investment grade, and EM bonds are not diverging from stock prices -yet.
Refinancing activity is ramping up – and purchase applications, too – as homeowners enjoy “one of the largest mortgage-rate tailwinds of the past 20 years,” says Bespoke Investment Group. (Outliers can revert with velocity.)
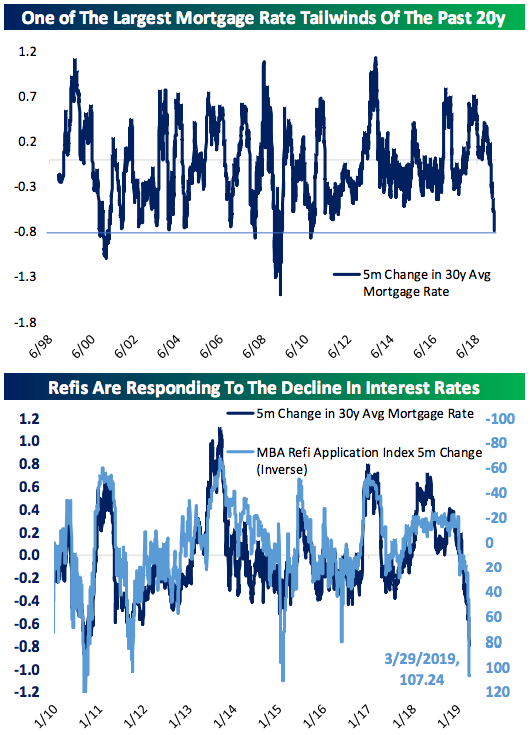
The combination of surging refi activity and collapsing swap spreads bolster the case that convexity hedging had accentuated the bull-flattening in the Treasury curve, Luke Gawa
So rumor has it, the yield curve flattening was not a skiddish bond market anticipating recession. It was just hedging?! I didn’t think bonds had that kind of structural defect to render them so vulnerable, but maybe?
Regardless, Wall Street banks are cutting their forecasts for Treasury yields and shelving calls for the Federal Reserve to hike interest rates this year amid signs of slowing economic growth. From Goldman Sachs Group Inc. to JPMorgan Chase & Co. to Morgan Stanley to Royal Bank of Canada – forecasts for how much bonds will sell off are being slashed.
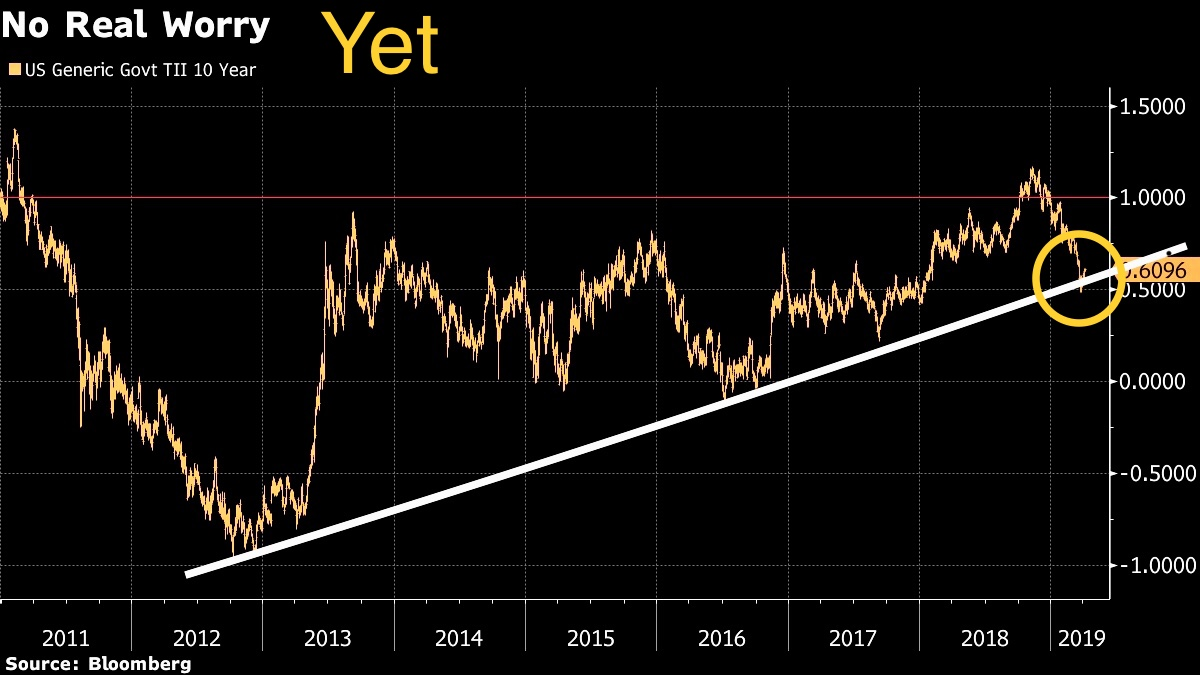
Unless 10-year real yields threaten to break above 1 percent (as they briefly did in 2018), the bond market won’t likely scare the equities market. (Unless that trend-line holds and they rise instead – slowly at first, and then faster.)
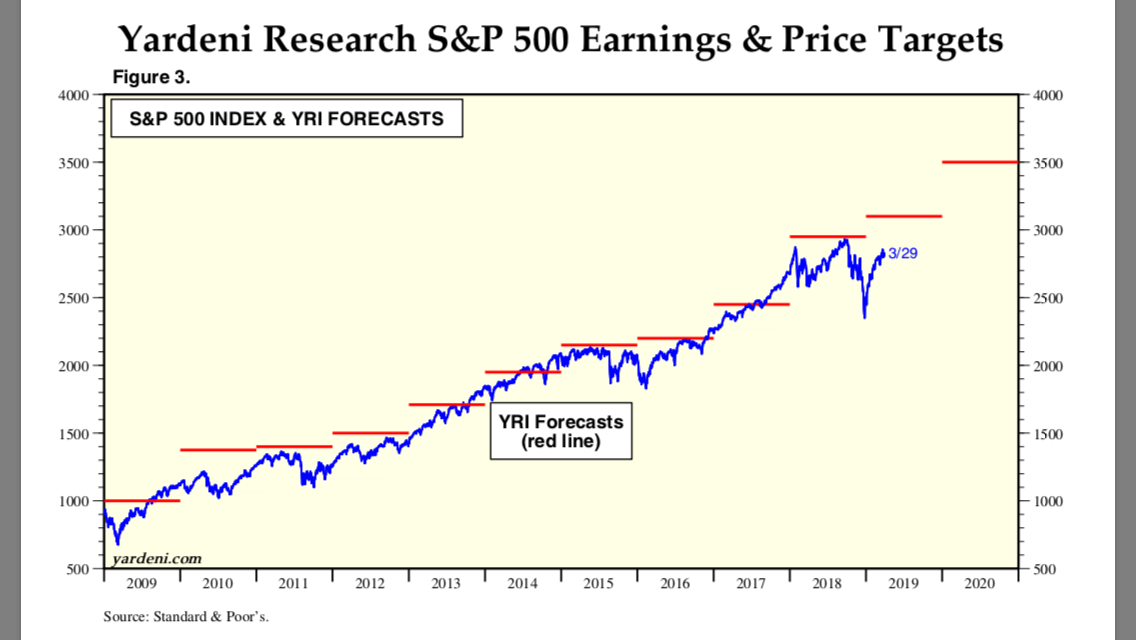
Ed Yardini is bullish earnings. (Wonder if he is basing his Q1 growth on energy sector coming in significantly higher than the analysts consensus – catching up with the acceleration of crude price in Q1. That’s my lone sector earnings bullishness.)
Brian Gilmartin is bullish:
Here is how the next 5 quarter’s look for SP 500 earnings growth. Remember, the SP 500 laps the tax cuts for the first three quarters of 2019 and then laps the earnings softening in Q4 and Q1 ’20. Like 2016, expect the Q1 ’19 to be the low-water point for SP 500 earnings growth this year.
- Q1 ’20: +15%
- Q4 ’19: +9.0%
- Q3 ’19: +2.7%
- Q2 ’19: +2.8%
- Q1 ’19: -2.2%
I’ve seen bullish math: If we get an 8% earnings growth in 2020 ($185/share), at a multiple of 17 we get ~$3150 as an SP target.
If the market advance is not done, we could pull that forward by summer or fall of 2019!
So aggressive CB’s slam the net yield of the government bond universe deeper into negative territory, investors continue to be forced out the risk curve. REGARDLESS of the economy. Future PE ratios just keep rising.
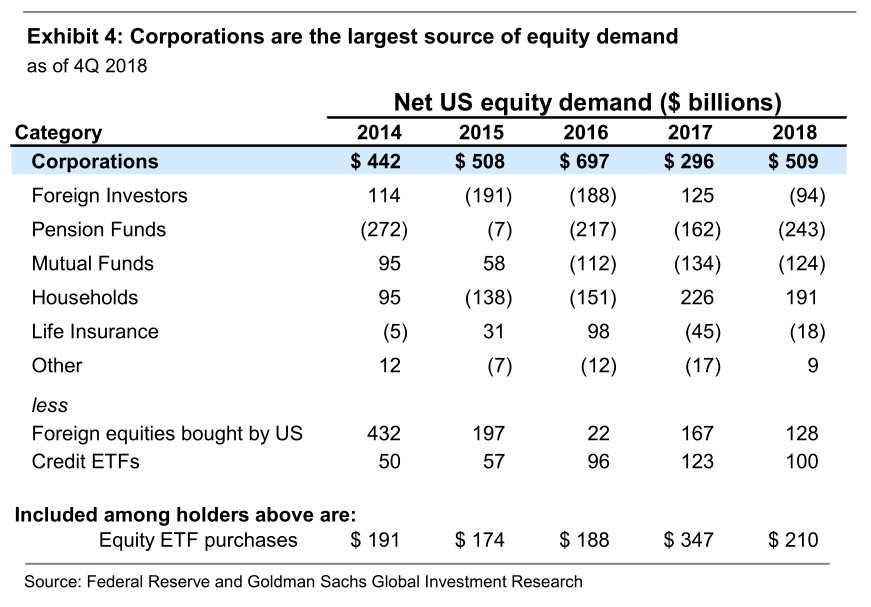
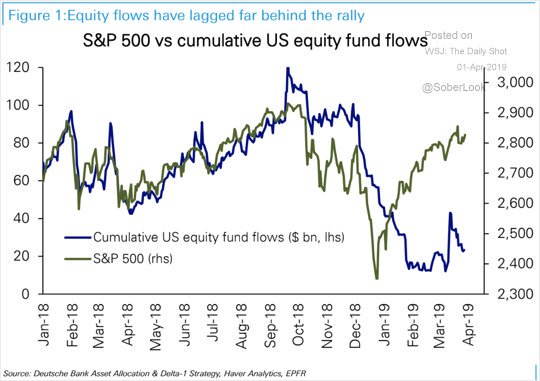
So Who’s Buying?
Basically US Corporations made up for most all other money pulling out… so that net/net, in 2018 market had no gains (other than Cash made money). Scarcity of stock and Buybacks are the structural tailwinds. Retail, pensions and foreign investors retreating are the headwinds.
Besides stock buybacks, pension rebalancing and some short covering, why else might the market rise without pause off the December lows?
Gamma Hedging: Index delta-adjusted open interest is now $446bn (vs. -$1.2tn at the Dec’18 lows, and $916bn at Jan’18 highs). This is the gamma imbalance, where the higher the market rises, the more dealers are forced to buy. It’s not short covering to be clear, but rather quant weighted market balancing.
J.P. Morgan is of the opinion that if financial conditions remain favorable, economic conditions continue to improve and the geopolitical trade feuds are settled favorably, the gamma imbalance will accelerate, forcing more dealer buyers of the underlying (stock) and possibly leading the S&P 500 to achieve 3,000 by month’s end or early May.
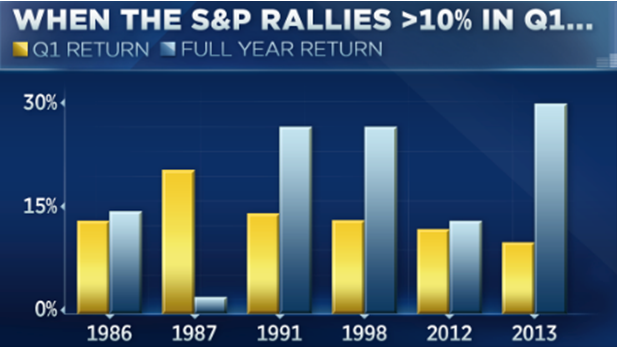
And as you would imagine, even Quants are bullish. In 9 of the past 10 times since 1950 that the S&P returned more than 10% in the first quarter, it went on to post double-digit gains for the year, according to LPL Financial’s Ryan Detrick. The one exception was 1987, when the market crashed on Black Monday.
Consensus would agree: Big picture thesis remains Positive
Some leading data is improving like March ISM manufacturing >55 and NYSE A/D line at an all-time high. Michigan Consumer Confidence is at a 5-mo high and Leading Economic Index is at an all-time high. Cam Hui @HumbleStudent did a great job of making the case for How the market could melt up and Why the yield curve panic is a buying opportunity.
Here are the Other Top 5 Reasons that sum up the Bullish Case:
- Earnings growth, margin and profit contraction will trough in 1st half and recorver in 2nd half.
- The Fed had promised 4 more hikes and is now intonating it may lower rates at same time it ends its balance sheet run-off in September. Global yields are mostly negative which further incentivizes risk-on behavior.
- Global economic slowdown, notably in China, is now showing ‘green shoots’ that it may “bottom” in H1 before trending higher in H2.
- With light positioning in the market by institutional investors and fund managers, if economic data and FOMO price action continues, side-lined money could enter the markets, inducing a melt-up.
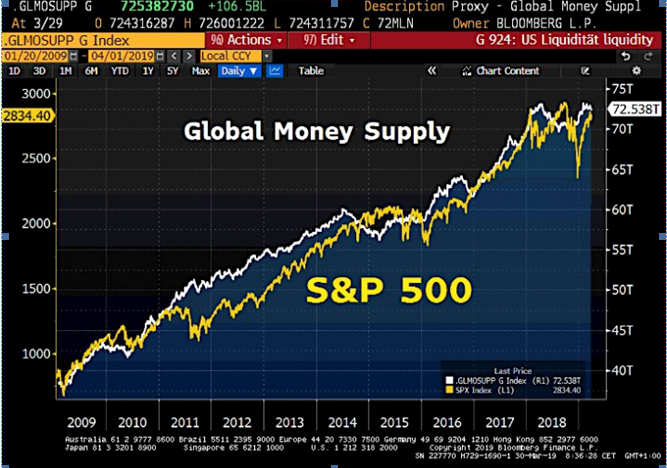
- An increase in money supply generally breeds complacency and greater liquidity.
So Where are the Headwinds?
- Earnings are slowing.
- Sales are slowing.
- Margins are contracting.
- Economic growth is slowing – worldwide
- Fed and White House are intonating rate cuts at the same time employment is under 4% and the stock market is at all-time highs. If the Fed does cut the Fed Funds Rate 50 basis points, that action alone would be the trigger for high inflation and a euphoric run up and then collapse in our stock market bubble.
The divergences between bad data and price appreciation in the indices are growing.
While China tries to temper buying euphoria in its stock market – wherein Analysts Downgrade China’s Stocks at Fastest Clip Since 2011 via Bloomberg – US is throwing everything at its market to make it go up! While China is shutting down Bitcoin – as a way to keep Chinese Yuan from leaving/converting to US Dollars – US fiscal and monetary policies are working to deflate the USD against the growing demand by emerging markets for more USD!
Event Risk
- Beyond the questionable Fed nominations (Moore and Cain) and beyond the Mueller report…
- Beyond the yield curve inversions and beyond the recession fears…
- Beyond little progress or believable deadlines from US China trade discussions, NAFTA 2.0 and Brexit…
- Beyond the threat of global growth slowdown and global cultural populism…
- Beyond the twin deficits and threats to democracy…
We still have the risk of a Black Swan event that is made possible from details and divergences presented above.
- What If Saudis Sell: Reports were rejected but what if… US revokes OPEC’s exemption from its anti-trust laws, as some in Congress and Trump continue to press, resulting in Saudi Arabia threatening to accept payment for its oil in currencies other than the US dollar. If it did come to it, some of Saudi assets in America would also likely be sold. The Saudis own roughly $1 trillion of US assets, including around $160 bln in US Treasuries.
- What If Stock Buybacks are Banned: Corporate buybacks have dampened volatility & prolonged the bull market, say Goldman Sachs analysts, adding, “Without company buybacks, demand for shares would fall dramatically.”
[I wrote about this last August – What If – Price Discovery And Stock Buybacks ]
3. Who Knows … but point is, there is a lot of Event Risk we can’t see so the market can’t price it in, but given it’s not very good about pricing in the Risk we do see…I tend to focus on the Technicals while the underlying details and divergences work themselves out.
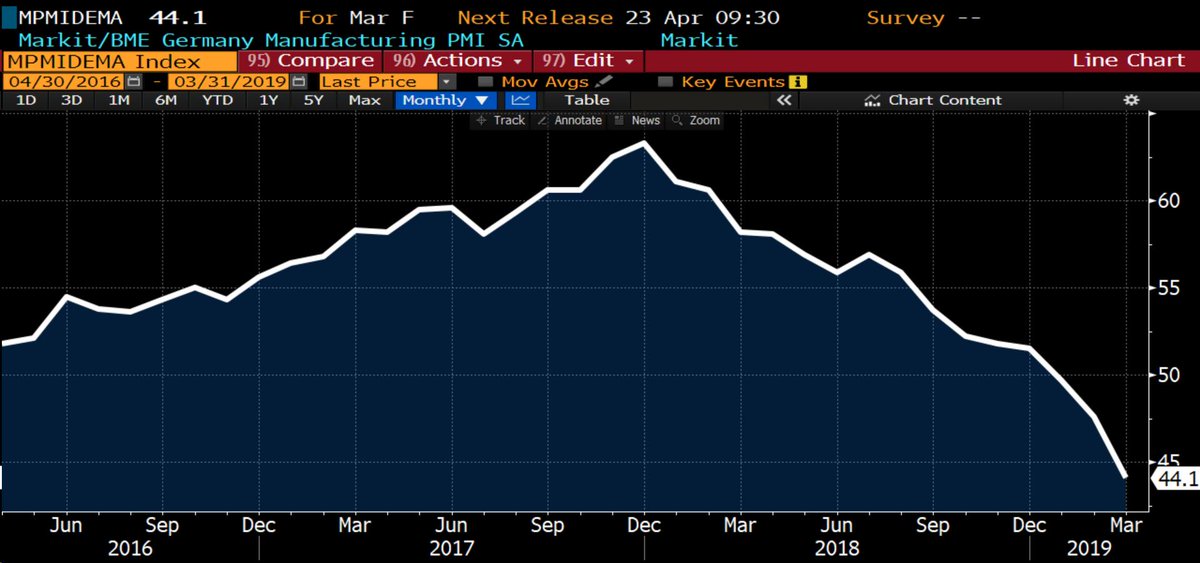
Global Trends Are Not Our Friend
#Germany‘s March Manufacturing#PMI was adjusted even lower to just 44.1.
#US Retail: February was supposed to see a post-bad weather/government shutdown rebound but instead retail sales fell 0.2%. Even with the upward revision, the three-month trend is running at a -4.3% annual rate. @EconguyRosie
#US ISM: Interesting how a 1.1 point increase from the prior month but -4 points lower than a year ago is insanely bullish. @GreekFire23
#Eurozone: greatest contraction of manufacturing activity in six years. Markit
#US Housing: data is cautionary:
- Home prices grew at the slowest pace in more than six years, with the S&P CoreLogic Case-Shiller 20-city index rising at a seasonally adjusted rate of 0.2% in January compared with December.
- Pending home sales fell 4.9% from the year earlier, the National Association of Realtors said.
- Contract signings for homes have declined on an annual basis for 14 straight months.
Here’s what happens next to the S&P when Housing Starts’ 12 month moving average falls 5 consecutive months, while Unemployment is under 5% (i.e. late-cycle)
As you can see, this is how the 2007, 2000, 1973, and 1969 bear markets started (there was a lead time of 1+ years from 2006-2007). But there were also false bearish signals in 1964 and 1966 Troy Bombardia

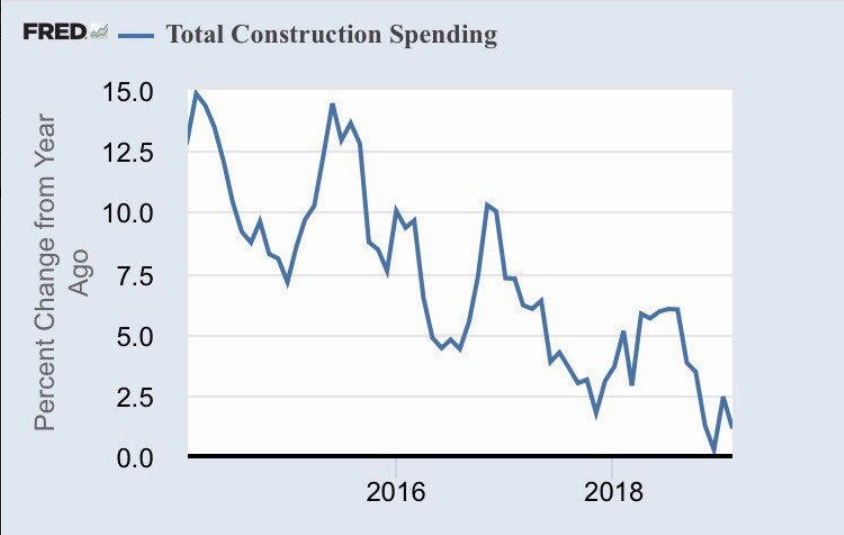
#US Construction Report was not strong:
#Corporate Debt is a Potential Amplifier in a Slowdown especially since U.S nonfinancial corporate debt as a percentage of GDP is now higher than the prior peak reached at the end of 2008.
BIS sounds alarm on corporate debt pile-up – FT
Private equity firms are taking on too much debt in the competition to win deals, heightening the risk of a crash in the sector: Bain’s Lavine
Divergence are Growing
The Fed has effectively eased monetary policy since the December stock market drop when Powell pivoted by slamming the breaks on their “rate normalization” plan. The market believes the Fed will go to great lengths to communicate to the markets that they will not kill the economic recovery, but the Smart Money is staying away as they are not overly trusting it seems that the Fed hasn’t already damaged the economic recovery.
The main concern seems to center on global growth slowing enough to provide headwinds for corporate earnings so the Fed cuts rates which results in credit and stocks truly overheating as the cycle nears its end – risking recession.
Before the recent Powell Pivot, the main concern was all about the Fed tightening into falling inflation and global growth slowdown.
For the fundamental case to support higher valuations, we need growth – economic and earnings. And both are slowing domestically and abroad. So where is the growth going to come from? US Infrastructure? Lower USD? Reflation Trade from higher Oil, Emerging Markets and Commodities?
If the US Dollar continues its advance, that is EM contracting and can trigger a USD short squeeze that would quickly send volatility through the credit markets causing equities to be repriced. Back in late January 2018, stocks and bonds sold off together – which was highly unusual. Now bonds and equities are rising together!
And that’s why I see a smaller chance of a 1998-2000 blow-off-like market and more like a Big Wide Chop as we grind sideways and down into elections.
Embrace The Chop as it may be The Top.
Samantha
Thanks for reading and please consider joining me in my LIVE Trading Room where I take macro and market-moving news, give it context, and work through Value and Momentum trade ideas and set ups every trading day! For additional education, I provide my LIVE Trade Alerts from Interactive Broker and my Gone Fishing Newsletter.
At LaDucTrading, Samantha LaDuc leads the analysis, education and trading services. She analyzes price patterns and inter-market relationships across stocks, commodities, currencies and interest rates; develops macro investment themes to identify tactical trading opportunities; and employs strategic technical analysis to deliver high conviction stock, sector and market calls. In addition to running a LIVE Trading Room, Samantha offers her Macro-to-Micro trade set ups through a LIVE Portfolio (across multiple time-frames) with Real-Time, Brokerage-Triggered Trade Alerts (sent via SMS/email/Web). Every trade has a Time-frame, Thesis, Trigger, Entry/Stop/Profit Price based on the underlying asset as well as Option Tactic. Samantha excels in chart pattern recognition, volatility insight with some big-picture macro perspective thrown in.
Follow her on Twitter: More Macro: @SamanthaLaDuc More Micro: @LaDucTrading and StockTwits @SamanthaLaDuc
Important Disclosure: LaDuc Trading/LaDuc Capital LLC Is Not a Financial Advisor, RIA or Broker/Dealer. Trading Stocks, Options, Futures and Forex includes significant financial risk. We teach and inform. You enter trades at your own risk. Learn more.