I sent out a warning for a market rollover: July 22nd.
“my breadth indicators (this is but one) are indicating the roll-over is just starting. The indices just don’t know it yet .” Samantha LaDuc

And here we are… August 5th, and that doesn’t even take into account the dump in futures. We will will be “oversold” by morning but still need to work through the oversold level (stabilize) and reverse before it is clear the market has what it takes to move higher for a bounce to fill many of those gaps it made Sunday night on China retaliation talk.

Here’s another warning and timing for the roll:
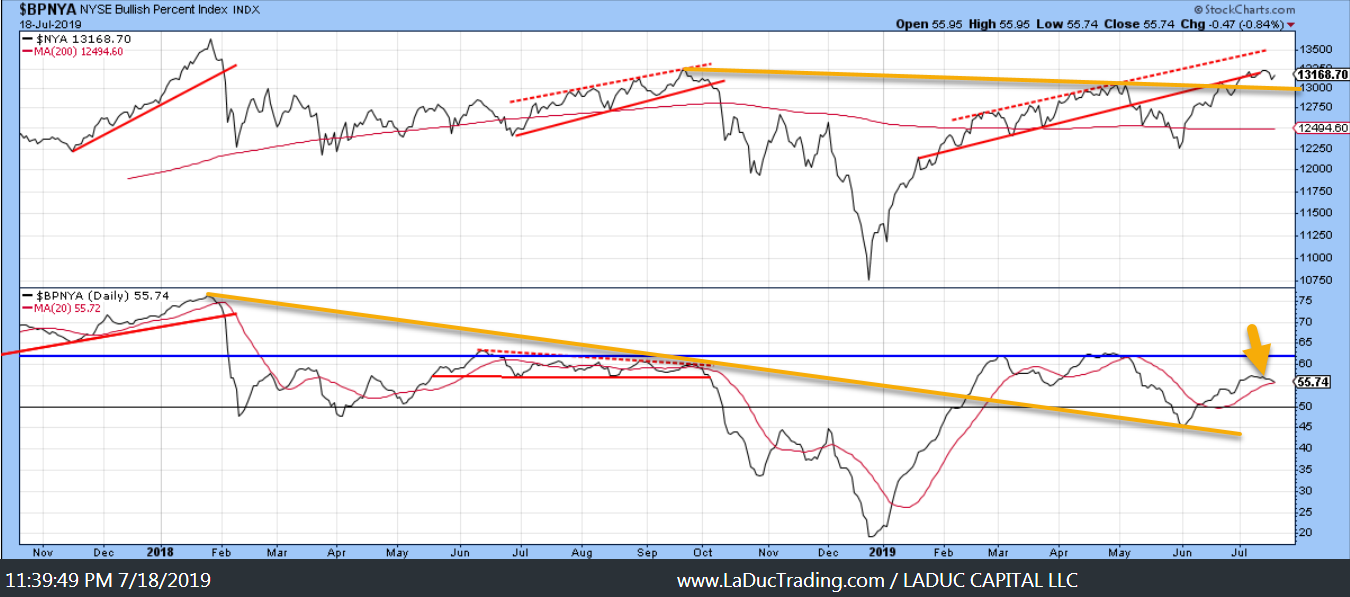
Fave Chart is NYSE for charting. Here I use the Bullish Percent NYA indicator to visually represent ‘flow’. Flow is about to break the 20D pulling NYSE down into that (yellow) trend-line (top panel). I suspect it breaks but not until a week after FOMC. SamanthaLaDuc
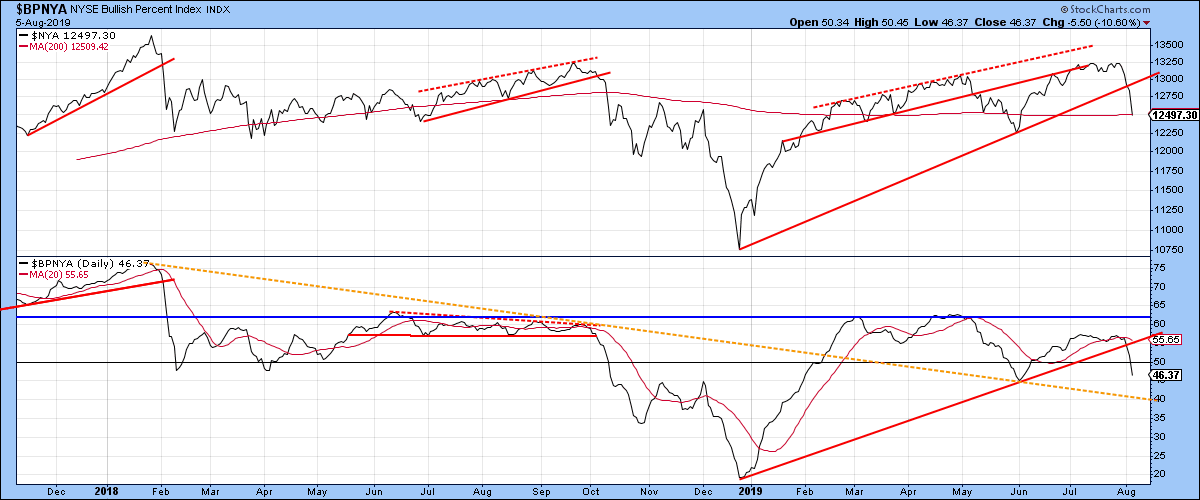
And now?
THIS is from my June 19, 2019 MarketWatch Article, Stock market will be sorely disappointed by a Fed rate cut:
This dramatic fall in yields doesn’t look done — either from the above Treasury Volatility MOVE chart (breaking up) or the bond market intonating 10-year rates are going lower to 2.0% this summer. It wouldn’t surprise me to see 1.75% by end of year.
Today, the 10-year closed at 1.735.
My view in a note to clients:
I mean, this is Crazy Ivan kinda stuff. Big Volatility in Yield world gonna spill over to equities is my bet …
Russian Captains sometimes turn suddenly to see if anyone’s behind them.
We call it, Crazy Ivan.
Anything you can do is go dead, shut everything down, and make like a hole in the water.
With that, I did ‘make like a hole in the water’ and was unharmed by this downdraft. Total Account Value was up 7.45% Friday for my new fund launched July 15th and +9.07% Monday night despite a near 5% drop in SPY. Want more market-timing calls and trade set ups before they happen? Come Fish With Me.
Brokerage-Triggered Trade Alerts!
The Week Ahead:
The economic news next few weeks will be slower, leading up into Jackson Hole, US Composite PMIs and Leading Economic Indicators reports Aug 22-24. This Monday we got the ISM Non-Manufacturing Index showing severe signs of slowdown after learning Friday that the ISM Manufacturing Index was the lowest in three years.
#earnings for the week $DIS $ROKU $CVS $CHK $TTD $TEVA $TSN $CRON $ATVI $KHC $CYBR $ON $UBER $STMP $MRO $TEUM $BKNG $TTWO $MELI $NBEV $L $BHC $SWKS $WYNN $OSTK $DBX $KOS $GWPH $OESX $PLUG $CAR $LYFT $SHAK $CTL $HEAR $AMC $APRN $REGN $PLNT $SOGO $WWhttps://t.co/lObOE0dgsr pic.twitter.com/0FzT1Uc7Ri
— Earnings Whispers (@eWhispers) August 3, 2019
Recent Client Posts Not To Miss: