Here Are Some of My Potentially Bullish Intermarket Analysis Charts
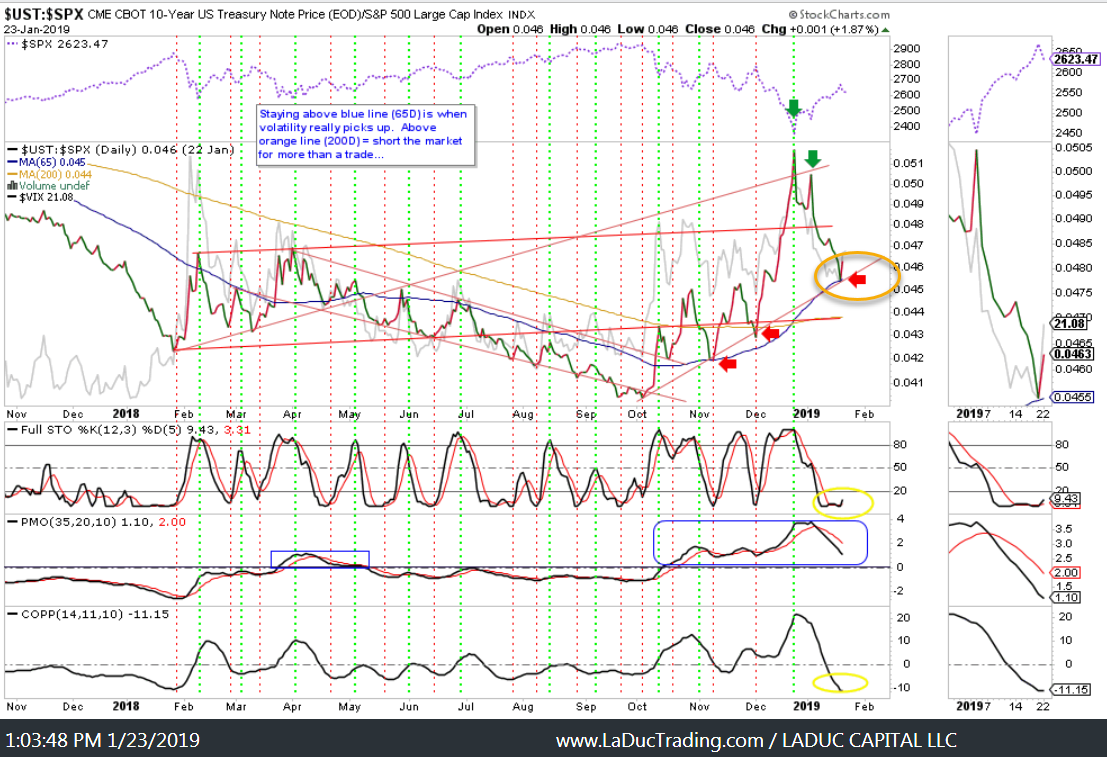
My Stock-Bond-Volatility ratio work says “yes, we may have a one-day wonder” in Volatility, but more likely we break the 65D and head down to bottom of the channel. That would mean SPX lifts upwards towards $2780 in February.
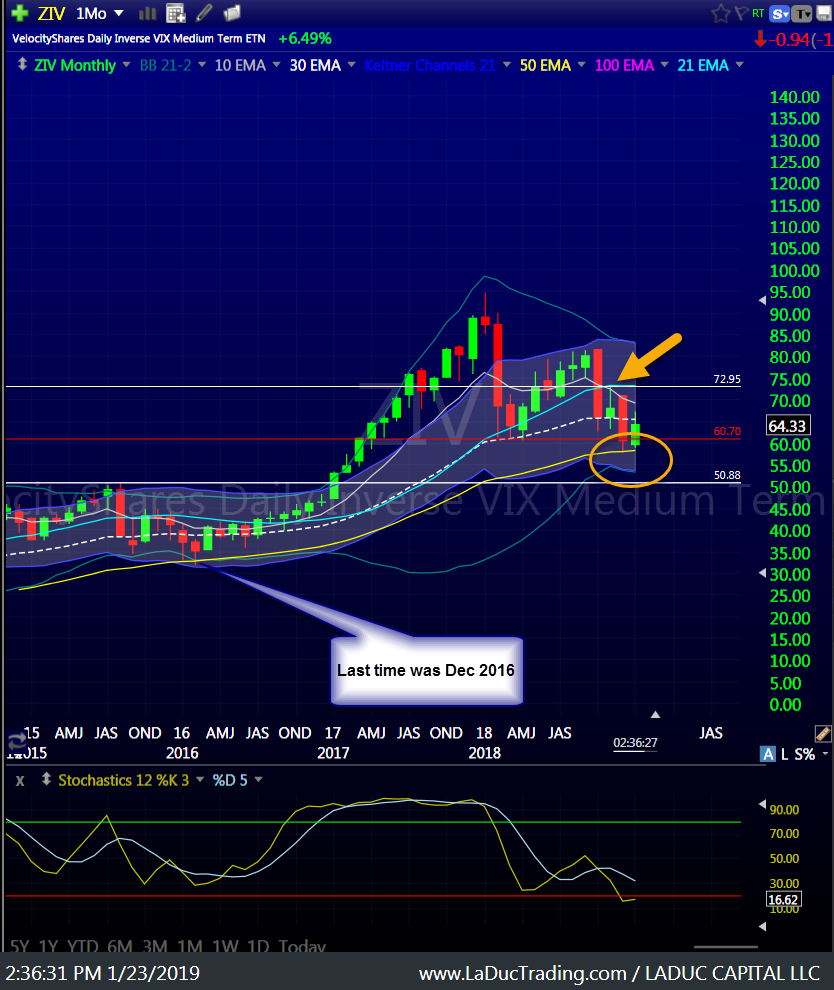
ZIV is my temperature read on the SPY. And it is bouncing on the 50M, where it has not been since Jan 2016 and has not closed beneath, ever. Do notice the 10/21 Mo EMA crossover – big picture bearish until this can get and stay above $73. In the meantime, $73 is my $SPX 2780 area.
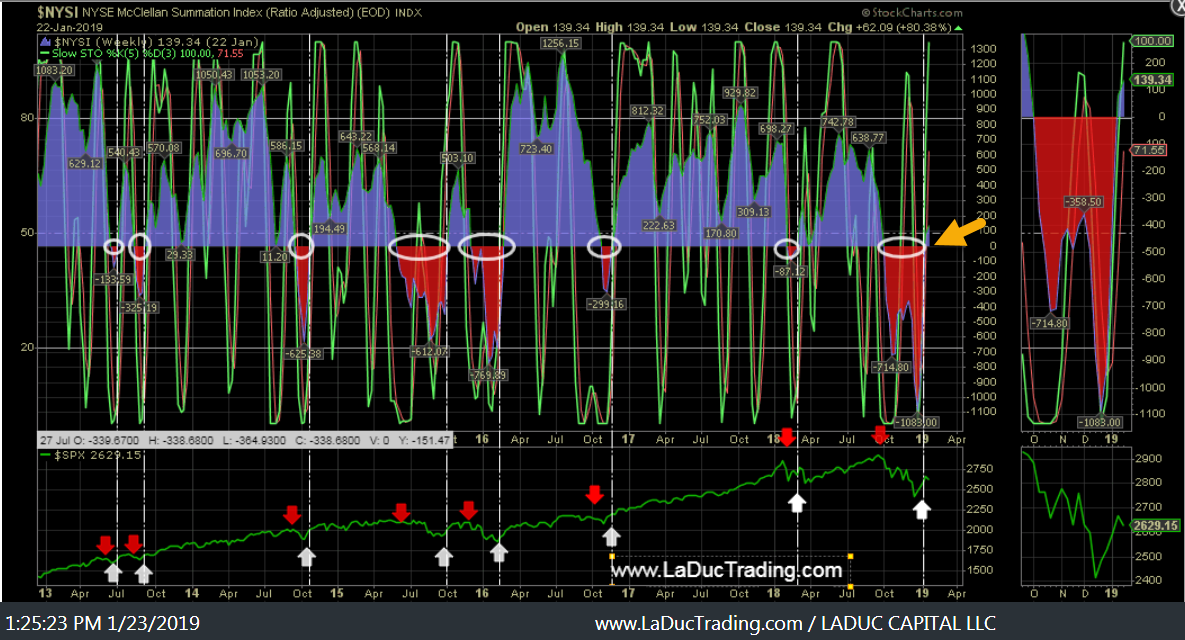
NYSE McClellan Summation Index (Ratio Adjusted) has finally crossed up through 0 which is a far cry from -1083, a low not set since 2008. It can climb higher still.
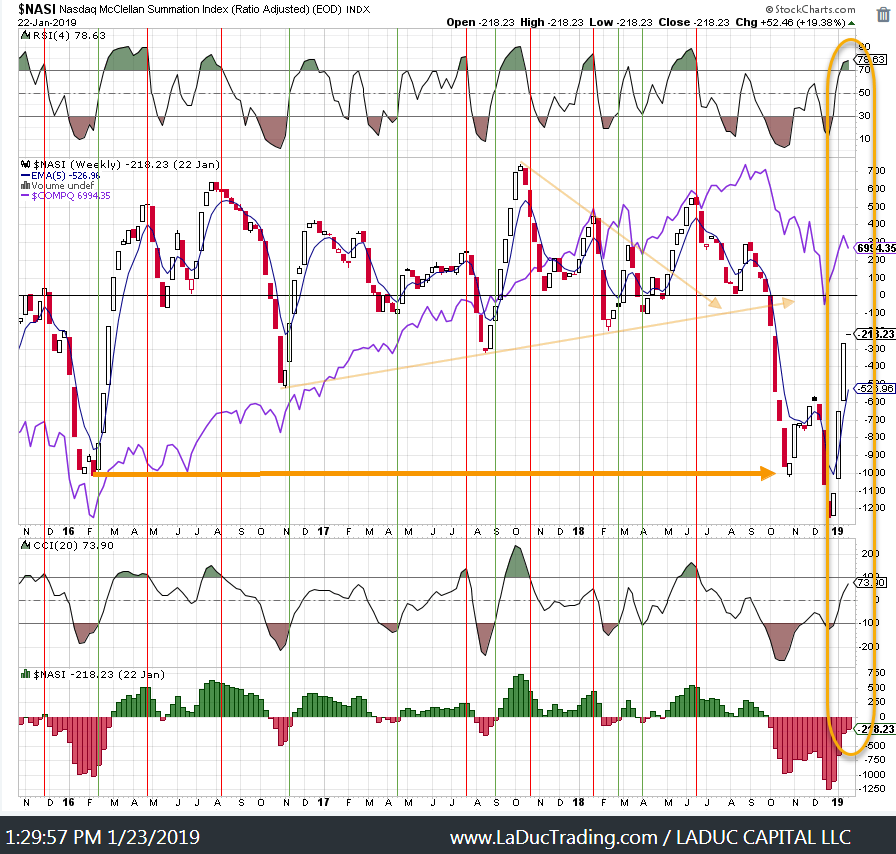
The Nasdaq McClellan Summation Index (Ratio Adjusted) has shown much strength. Great double bottom off that bullish divergence in the CCI.
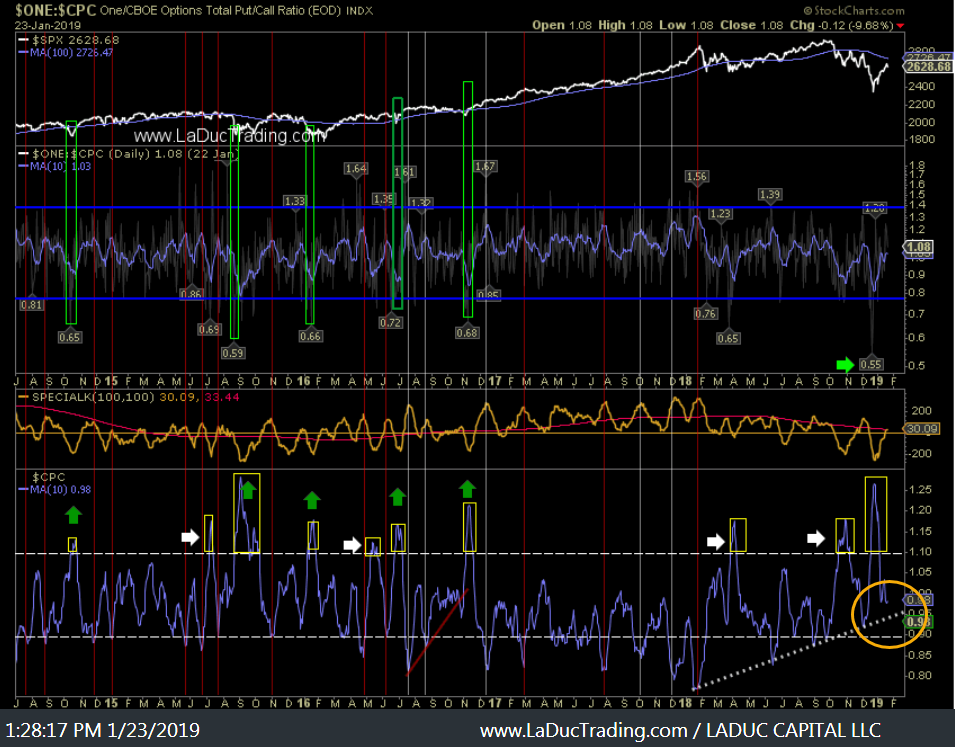
We are still rallying off the .55 Put/Call Ratio extreme reading (middle panel) from December 24th and have not yet tagged the 100D at SPX $2727 or broken the dotted white line in the bottom panel as a potential ‘go-short’ signal. General Rule with CPC: Look to buy when 10D reaches ~> 1.05 and sell when it reaches ~< .90.
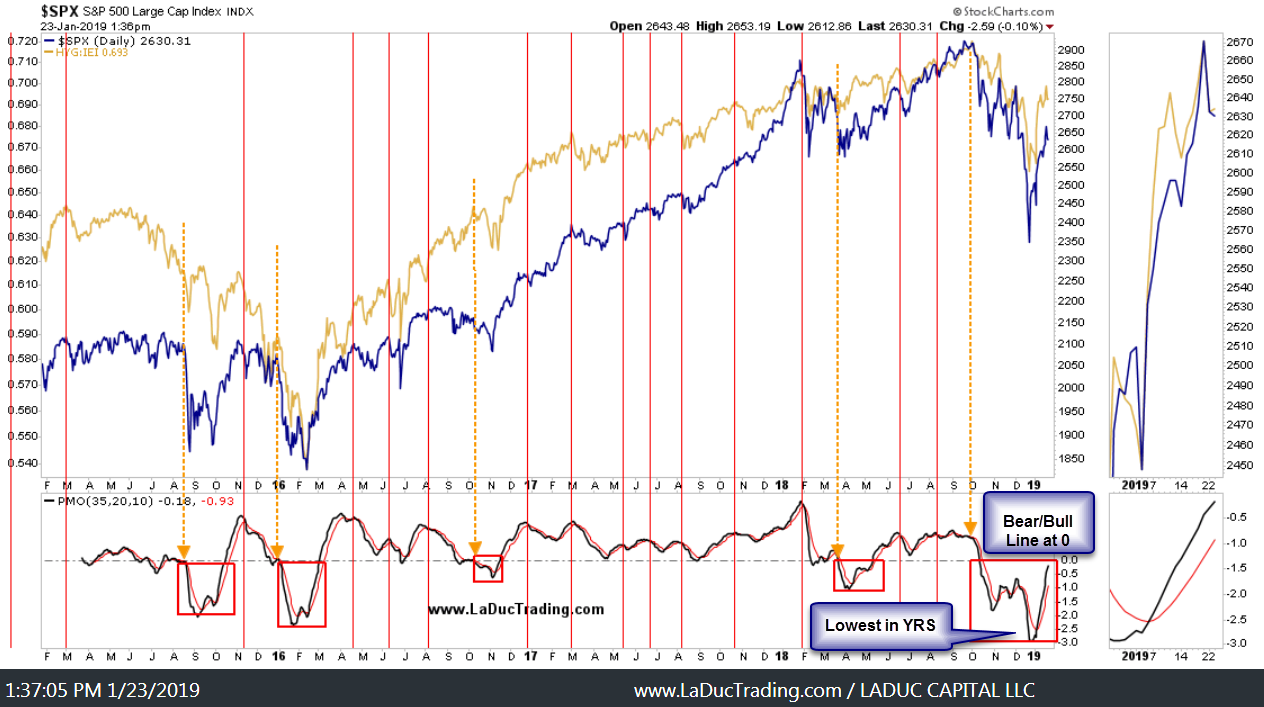
We have not yet crossed above the 0 line of the PMO Indicator for SPX, but I’m betting we are likely headed that way.
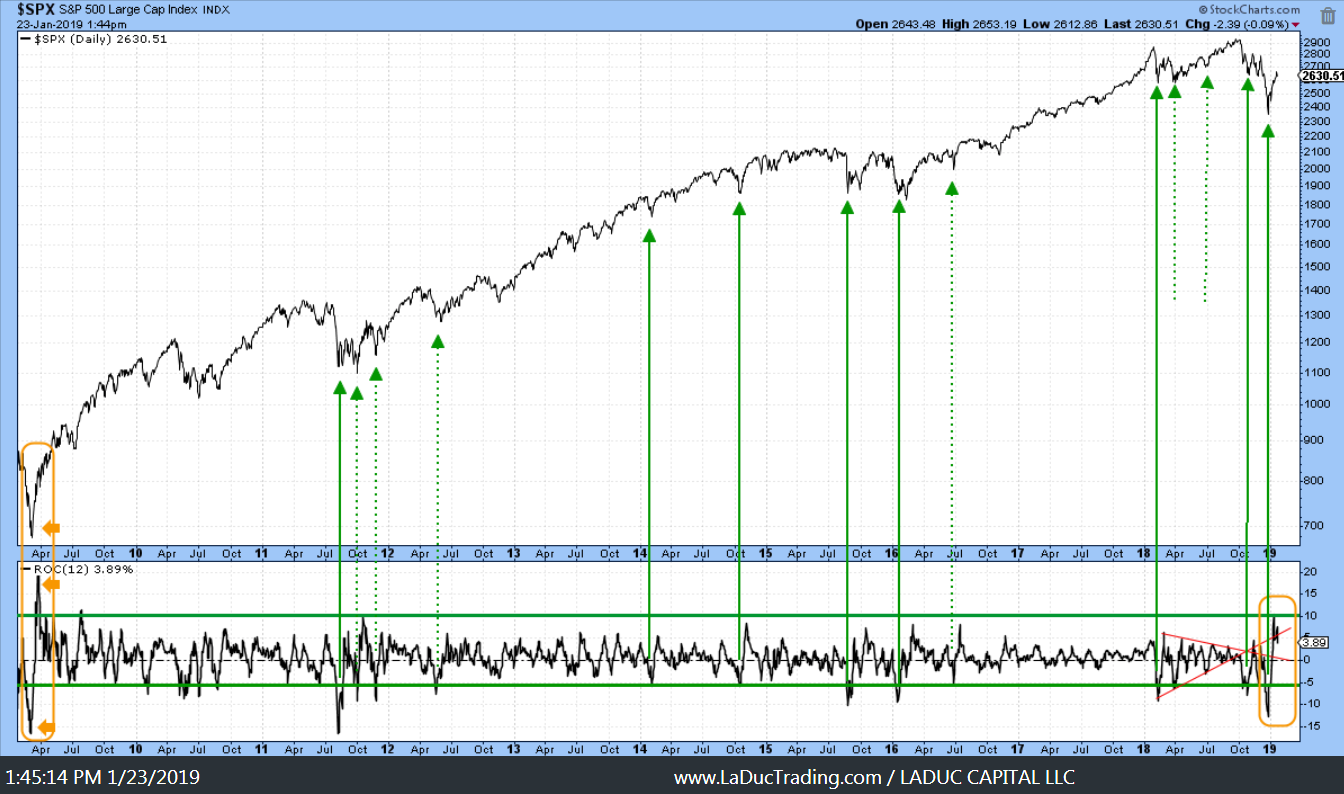
Strong breadth in SPX Rate of Change continues. This is bullish big picture, as you can see it was last this “expansive” during the bottom of 2009.
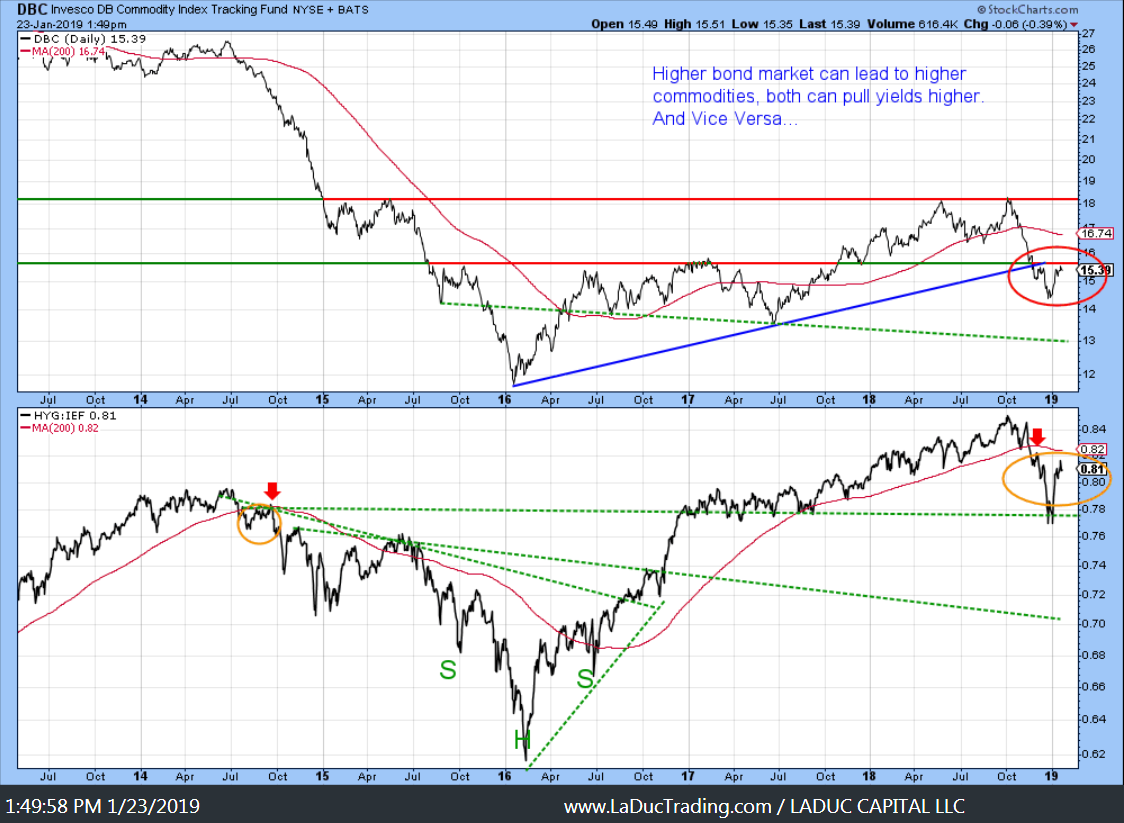
Inflation expectations are neutral, and, if anything, turning up. Maybe this is a tell that Recession Fears are overdone and Commodities will catch a bid?
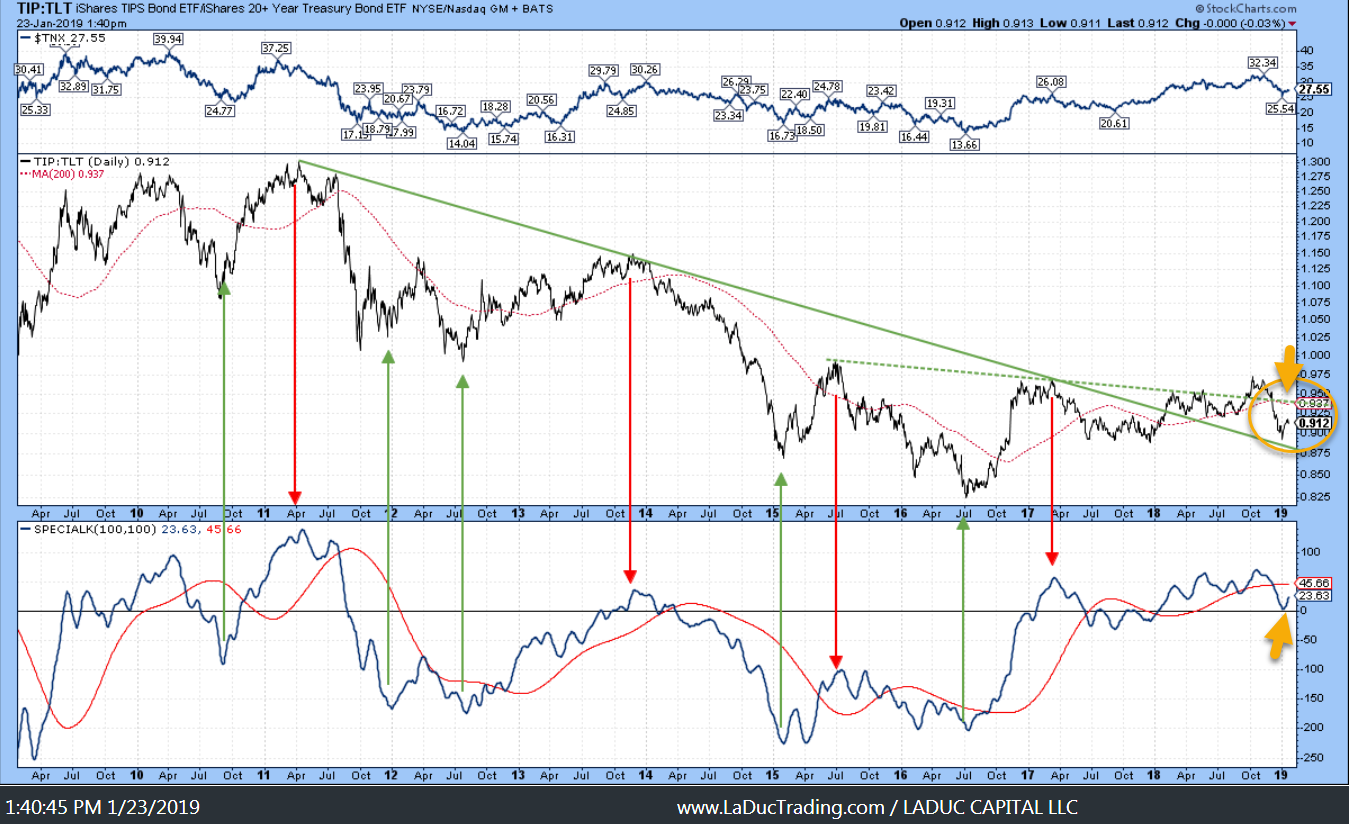
Speaking of Commodities…
I am expecting higher yields second half of 2019 and with that, higher bond ratio (HYG:IEF) can lead to higher commodities and both can pull yields higher.
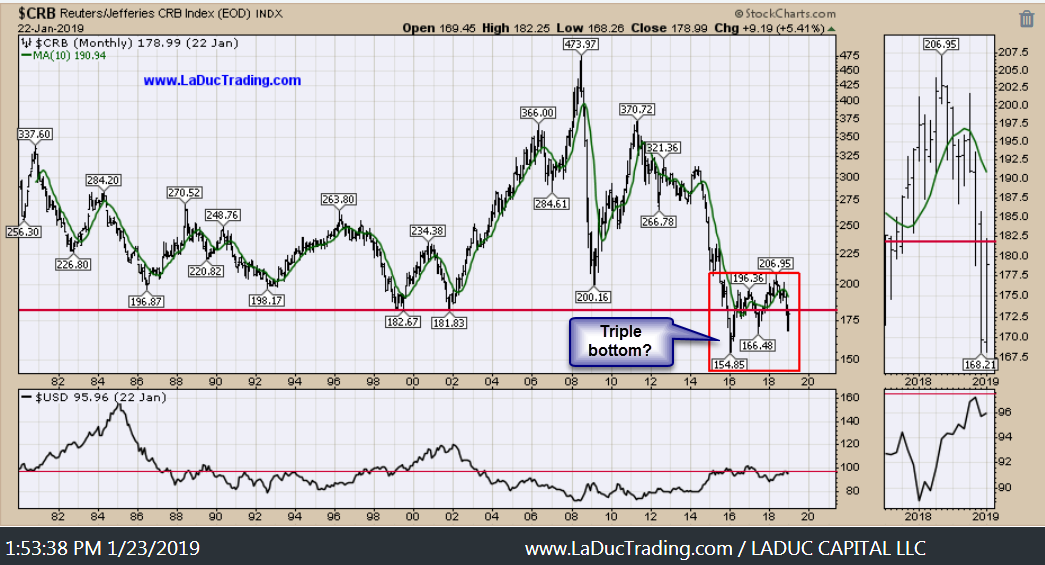
And maybe Commodities (maybe Oil) are setting up for a once in Three-decade low with a Triple Bottom…
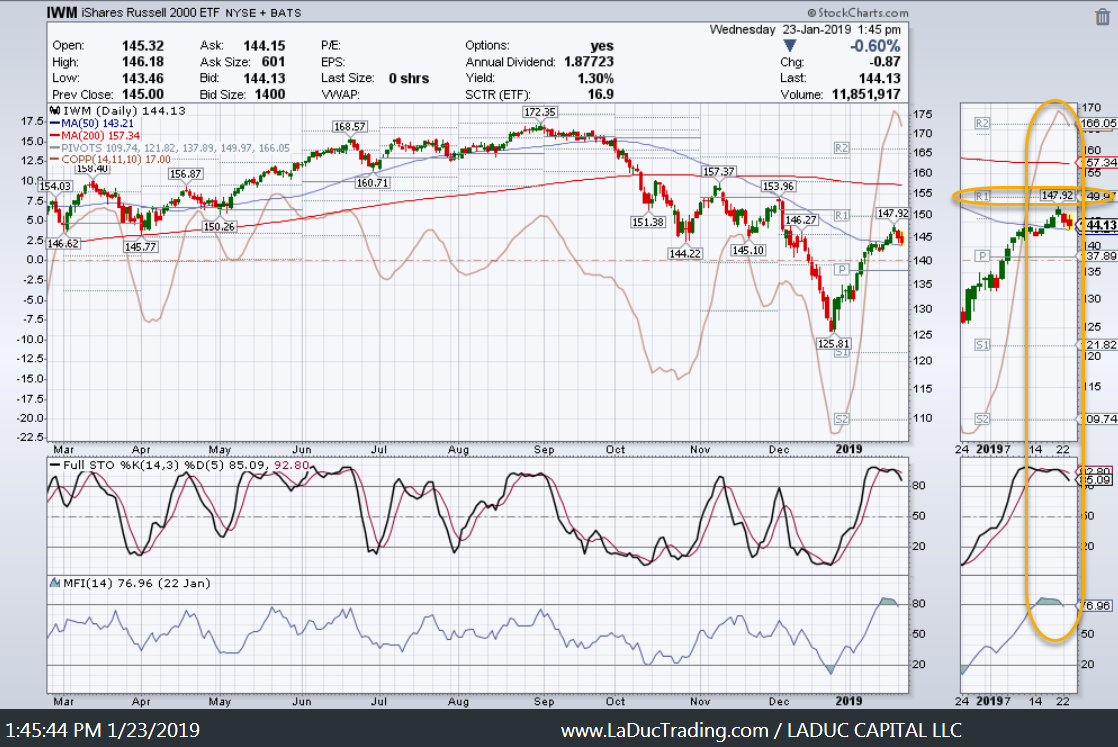
Indices are digesting/consolidating this large V-shaped recovery off the Christmas Eve lows. Yes, there is selling up here as indicated by the Money Flow Indicator but Coppuck Curve is above price action which indicates upward pull as the 50D serves as support. All the major indices look the same: IWM, QQQ, SPY as they toy with rolling over but are actually on decent support.
Thanks for reading and please consider joining me in the LIVE Trading Room where we work through Value and Momentum trade ideas and set ups every trading day.
At LaDucTrading, Samantha LaDuc leads the analysis, education and trading services. She analyzes price patterns and inter-market relationships across stocks, commodities, currencies and interest rates; develops macro investment themes to identify tactical trading opportunities; and employs strategic technical analysis to deliver high conviction stock, sector and market calls. Through LIVE portfolio-tracking, across multiple time-frames, we offer real-time Trade Alerts via SMS/email that frame the Thesis, Triggers, Time Frames, Trade Set-ups and Option Tactics. Samantha excels in chart pattern recognition, volatility insight with some big-picture macro perspective thrown in.
More Macro: @SamanthaLaDuc Macro-to-Micro: @LaDucTrading