by Samantha LaDuc | Apr 24, 2018
Trade Alert – #Chase XLF – OPEN TYPE SYMBOL POSITION SIZE ($1000) TACTIC: S or O THESIS E= STOCK UNDERLYING ENTRY PRICE S= STOCK UNDERLYING STOP LOSS P= STOCK UNDERLYING PROFIT EXIT ENTRY PRICE % SOLD EXIT PRICE DATE ENTERED DATE EXITED NOTES % PROFIT /LOSS REALIZED PROFIT /LOSS DAYS IN TRADE Chase XLF 1 […]
by Samantha LaDuc | Mar 16, 2018
Trade Alert – #Swing XLF – CLOSED TYPE SYMBOL POSITION SIZE ($1000) TACTIC: S or O THESIS E= STOCK UNDERLYING ENTRY PRICE S= STOCK UNDERLYING STOP LOSS P= STOCK UNDERLYING PROFIT EXIT ENTRY PRICE % SOLD EXIT PRICE DATE ENTERED DATE EXITED NOTES % PROFIT /LOSS REALIZED PROFIT /LOSS DAYS IN TRADE Swing XLF 2 […]
by Samantha LaDuc | Feb 20, 2018
Trade Alert – #Swing XLF – OPEN TYPE SYMBOL POSITION SIZE ($1000) TACTIC: S or O THESIS E= STOCK UNDERLYING ENTRY PRICE S= STOCK UNDERLYING STOP LOSS P= STOCK UNDERLYING PROFIT EXIT ENTRY PRICE % SOLD EXIT PRICE DATE ENTERED DATE EXITED NOTES Swing XLF 2 MAR 18 $29P MArket PB $29.00 $29.50 28.50, 27.75, […]
by Samantha LaDuc | Feb 9, 2018
Trade Alert – #Swing XLF – OPEN TYPE SYMBOL POSITION SIZE ($1000) TACTIC: S or O THESIS E= STOCK UNDERLYING ENTRY PRICE S= STOCK UNDERLYING STOP LOSS P= STOCK UNDERLYING PROFIT EXIT ENTRY PRICE % SOLD EXIT PRICE DATE ENTERED DATE EXITED NOTES Swing XLF 1.5 FEB 18 27P MArket PB $27.35 $29.25 26.65, 26.25 […]
by Samantha LaDuc | Feb 6, 2018
Trade Alert – #Idea XLF – OPEN TYPE SYMBOL POSITION SIZE ($1000) TACTIC: S or O THESIS E= STOCK UNDERLYING ENTRY PRICE S= STOCK UNDERLYING STOP LOSS P= STOCK UNDERLYING PROFIT EXIT ENTRY PRICE % SOLD EXIT PRICE DATE ENTERED DATE EXITED NOTES Idea XLF 1.5 JUN 18 $$25P WK Gap $27.50 $29.25 $25.00 $0.70 […]
by Samantha LaDuc | Jun 26, 2017
More Summer Treats: Premium Member Video update for nonmembers–again! In follow up to Friday’s LIVE Trading Room action (and Free Video), I sold the gap up this morning and turned around to short it. I’m staying short Tech despite end-of-quarter...
by Samantha LaDuc | Jun 24, 2017
Summer Treat: Premium Member Video for non-members! Here’s a Friday afternoon review of what Samantha traded in the LIVE Trading Room post Bio-tech bonanza, and it was a lot! First came precious metal bounce then industrial metals…now energy? Not to say...

by Samantha LaDuc | Dec 2, 2016
Much attention of late has been focused, with good reason, on rising yields, falling bond prices and the collapse in the Japanese Yen and Gold. So many assets are correlated that as a strategic technical analyst I look for macro themes to show themselves in...
by Samantha LaDuc | Dec 1, 2016
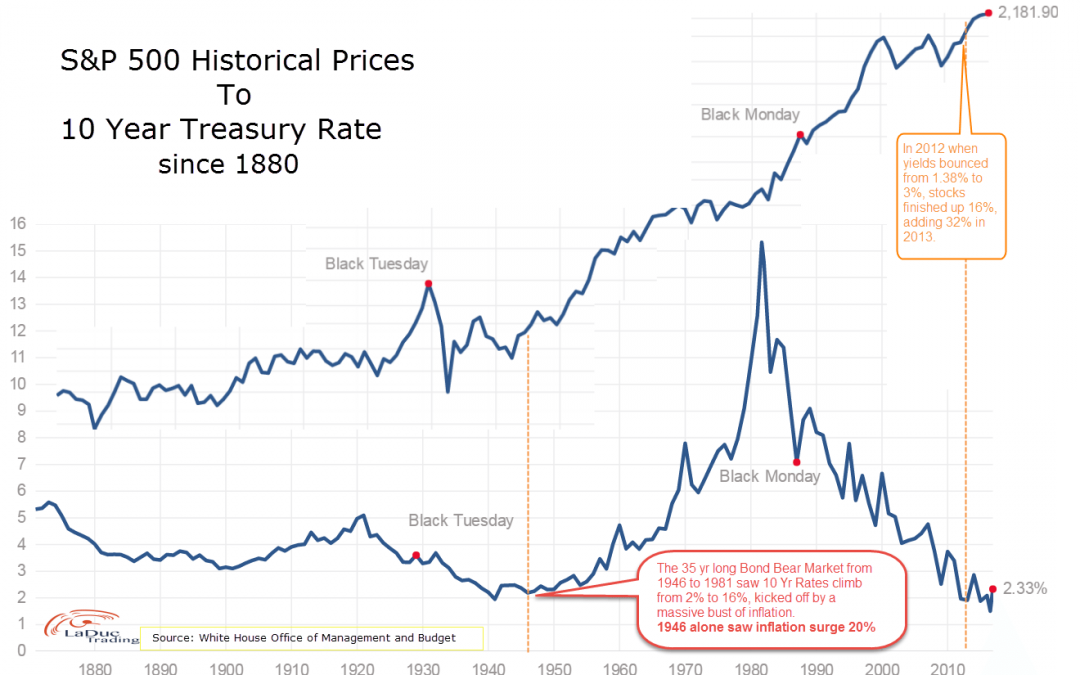
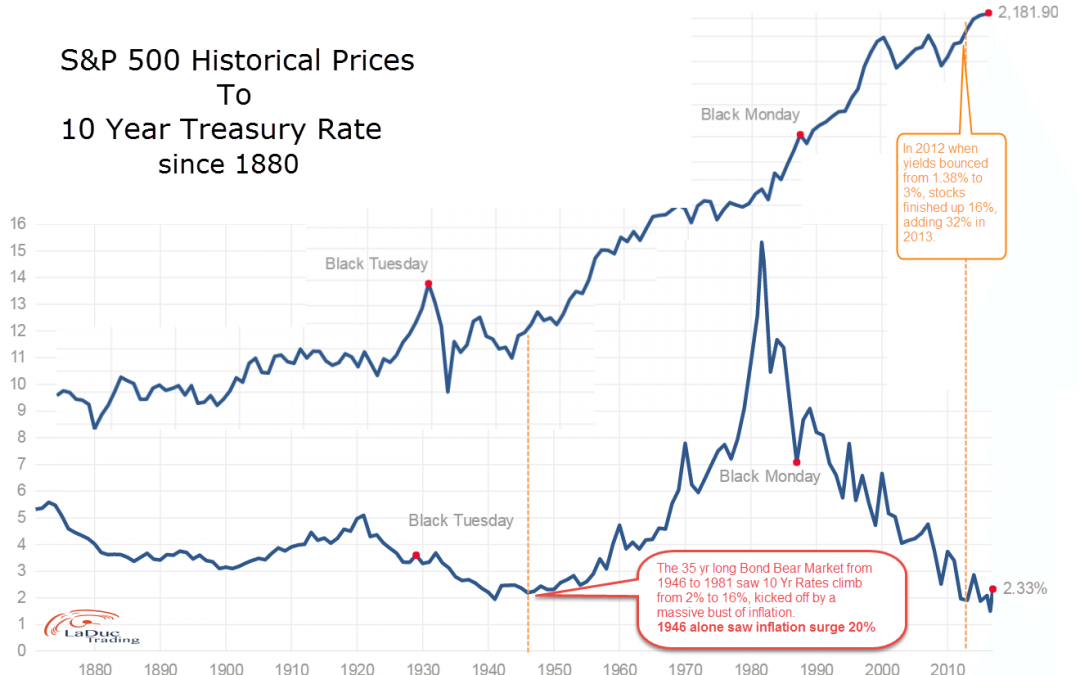
Higher Rates Can Be Bullish Interest rates follow very long term cycles. Above highlights a 35 year (1946-1981) bond market, but unlike our most recent 35 year (1981-2016) bond market, they were in a rising rate environment (for more than a blip on a chart). From a...
by Samantha LaDuc | Nov 28, 2016
S&P Bulls and Bond Bears Pin Hopes to 1946 Interest rates follow very long term cycles. Above highlights a 35 year (1946-1981) bond market–but unlike our most recent 35 year (1981-2016) bond market, they were in a rising rate environment (for more than a...

by Samantha LaDuc | Nov 22, 2016
Polls and predictive models failed to predict Trump’s strength let alone his win. That’s nothing. Wall street analysts and economists have been getting the rate thing wrong for years, and not by a little. Bloomberg reported hardly anyone on Wall Street saw the...