Higher Rates Can Be Bullish
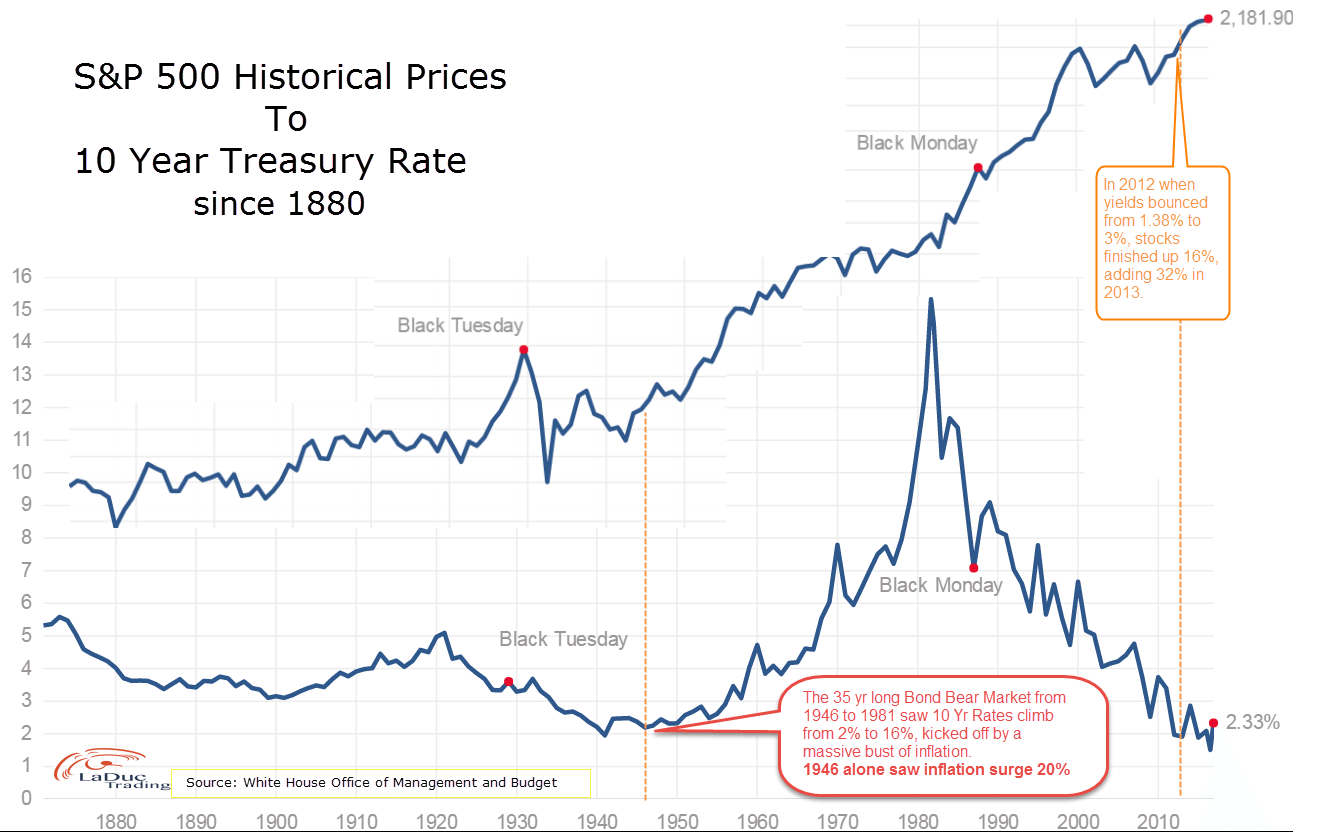
Interest rates follow very long term cycles. Above highlights a 35 year (1946-1981) bond market, but unlike our most recent 35 year (1981-2016) bond market, they were in a rising rate environment (for more than a blip on a chart). From a low of 2% to a high of 16%, yields were rising and bonds prices were not. A series of labor strikes in 1946 (big ones, like when U.S. troops seized control of US railroads during rail union strikes) pushed the American economy into an inflationary spiral so much so that inflation surged 20% that year, and with it yields broke-out.
Fast forward to 2016, our sudden spike in yields this year (10-year yield jumped 21% post-election, the largest weekly gain ever), prompted me to think of this 1946 analog. My point is not to detail and debate all of the ways our current economic, political and market environment are similar or different to 1946. Let’s face it, times were different. But there are some similarities in patterns I think are note-worthy, like the 35-year boom-to-bust and bust-to-boom cycle in 10 year Treasury Rates, and how bullish inflation and rising bond yields were to the S&P 500, in time.
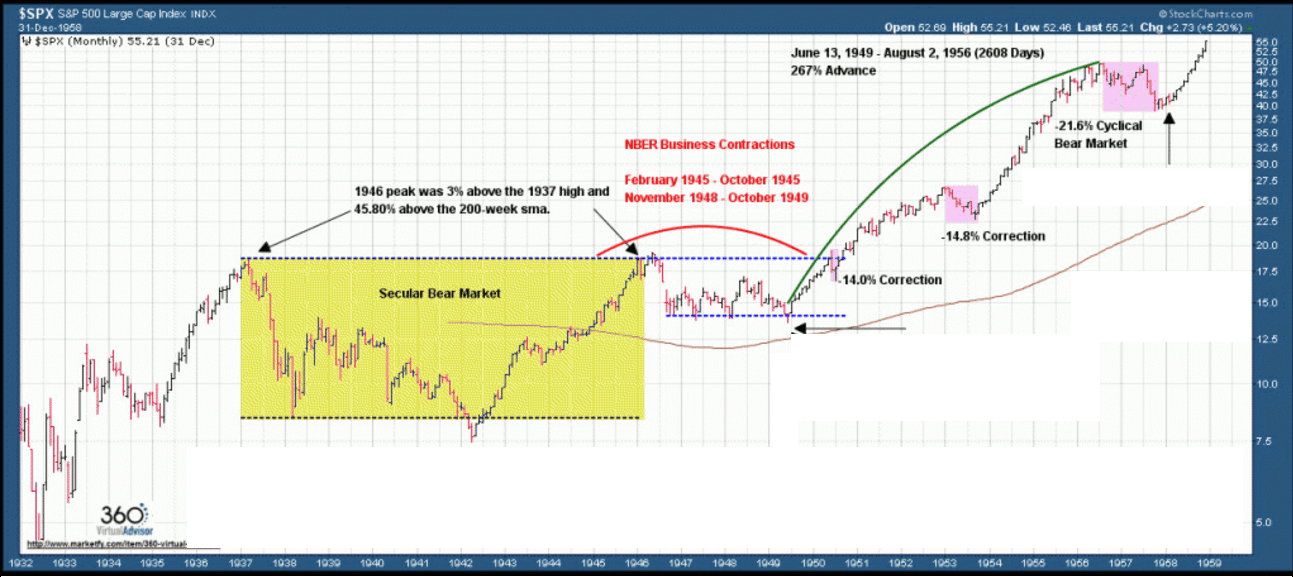
Big Picture: After that 20% surge in inflation in 1946, the market corrected ~30%. Then in 1949, the S&P 500 launched a new secular bull market that rallied 267% over the next 7 years before pulling back in 1956 – 1957 and taking off again.
Slice in Time: In 2012, when yields bounced from 1.38% to 3%, stocks finished the year up 16%, but that was nothing compared to the additional 32% the SPY added in 2013. Higher rates were bullish and they could be now.
We May Be Entering the Perfect Storm for an Inflation Surge
A very strong deflationary force in 1946 was government debt coming out of WWII, at 105% of GDP. That didn’t stop their inflation train. Fast forward to today and many would agree we have pulled demand forward and exploded massive debt. Now we need real demand, and moderate inflation, to grow us out of this predicament as it is proven we can’t rely on corporate investment (other than in themselves) or consumer spending (if they don’t have it to spend).
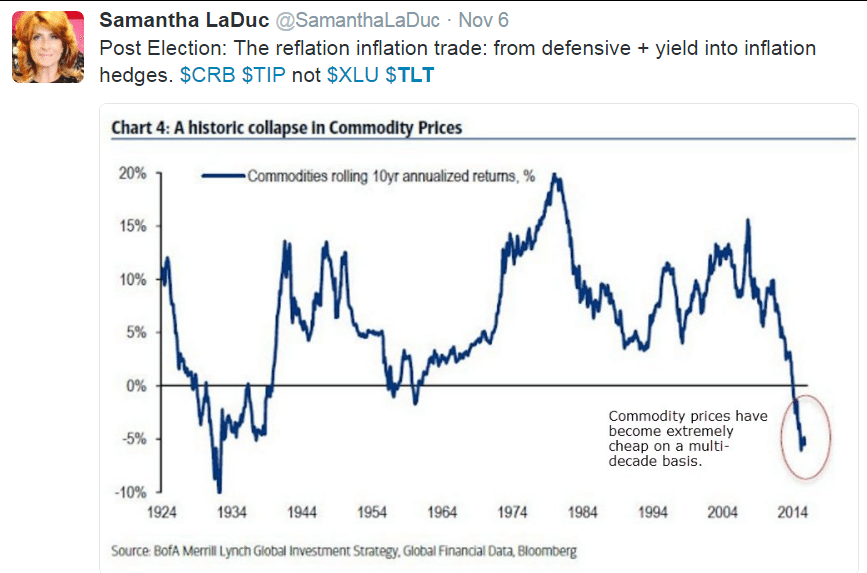
Commodities are at multi-decade lows: We have seen commodity stocks of late basing and in some cases breaking out of long-term consolidation patterns after a very intense 8 year decline. Steel, coal, and copper have had out-sized runs of late. Even TIPs (inflation-protected bonds) are back en vogue. This historic collapse in commodity prices has made their underlying stocks become extremely cheap on a multi-decade basis. This commodity exuberance is inflationary.
Higher Oil: The recent OPEC cut will likely put a floor under oil in the mid $40s and lead to $60-$70 oil next year, if not higher as this does not include shale producers’ unwinding their oil hedges. Higher oil alone will run inflation hotter.
Trumpflation: With Trump’s proposed protectionist trade policies, the net result will likely be higher paying US jobs, even if we have fewer of them. The natural consequence will be higher priced goods and services. Think about it: The populist movement is all about rebelling against the deflationary tendencies of manufacturers to chase lower wages all over the world the past 20+ years. Higher wages and higher priced goods are inflationary.
Trumponomics: The bond market is clearly pricing in the idea that infrastructure spending, tax cuts, rising deficits, immigration restrictions and protectionist policies are here to stay. The selloff in the bond market amid surging interest rates is the single most important piece of evidence. Higher interest rates and lower bond prices are inflationary.
Technical Analysts are Not Pollsters or Economists
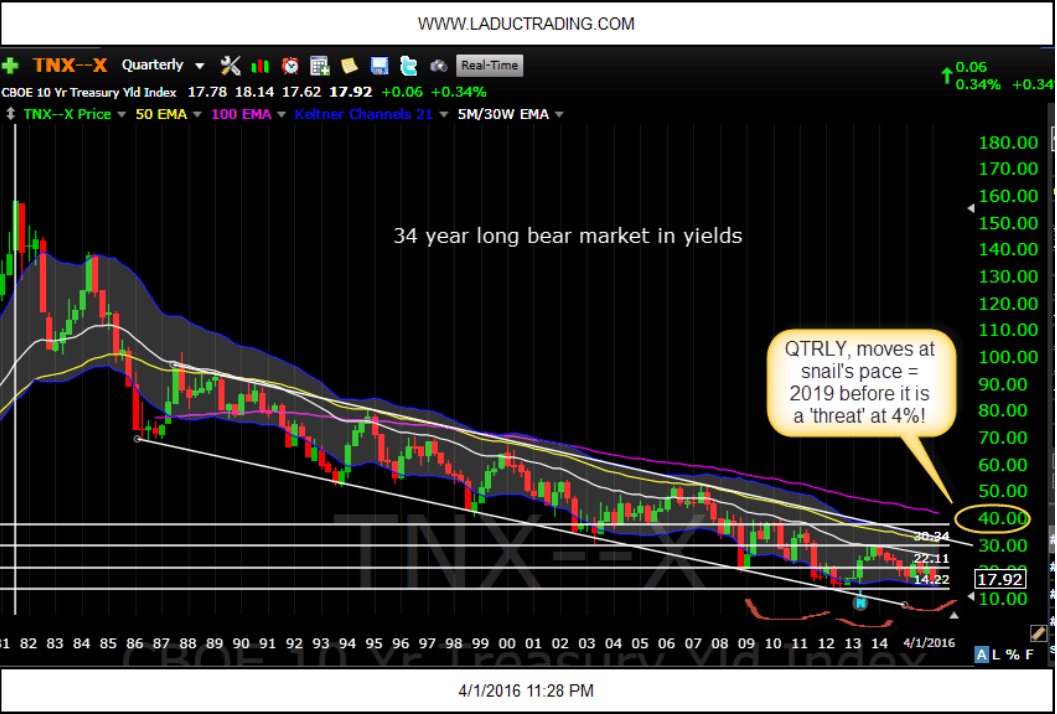
Back in April, I posted this chart of the 10 year Treasury Yield TNX and presented my analysis to the Boston Investor’s Group at MIT, suggesting that if rates stayed above a Quarterly Close of 1.42%, then rates were set for higher. (And that was not based on Trump, economic health, US dollar or FED!) Based on that nice inverse Head & Shoulders on this Quarterly chart, my price targets were 2.21% by year end then 3.03% mid 2017. That’s when it runs into Quarterly Trend line resistance which should be formidable. Until it isn’t. Beyond 3%, it is not hard to imagine a measured move from that inverse head & shoulders to 4% then 5% and in time to 6%, but it needs a few years. Unless the 1946 analog teases out.
Conclusion
A pro-growth, protectionist Trump agenda coupled with a rate-hiking Federal Reserve will likely mean higher rates, higher US dollar and with it a potential break down of the three-plus-decade bond bull market. With OPEC cutting production for the 1st time in 8 years, and commodities at multi-decade lows, I expect sector rotation from growth to value plays to gain steam and fuel the inflation train. All in all this is not market bearish.
The 1946 Analog of much-higher inflation (as long as wage growth keeps up), converging with multi-decade lows in commodity prices (as long as prices offset strength in the USD), not to mention an unprecedented, orchestrated Yen devaluation (assuming currency trade wars aren’t incited), could be be the macro backdrop that propels US yields and US dollar and US markets much higher next year.
Friendly Note:
It’s easy to subscribe to my Free Fishing Stories/Blog.
You are also invited to Come Fish With Me!
Thanks for reading and Happy Trading,
Samantha LaDuc