
Market Thoughts: Value, Here Me Roar
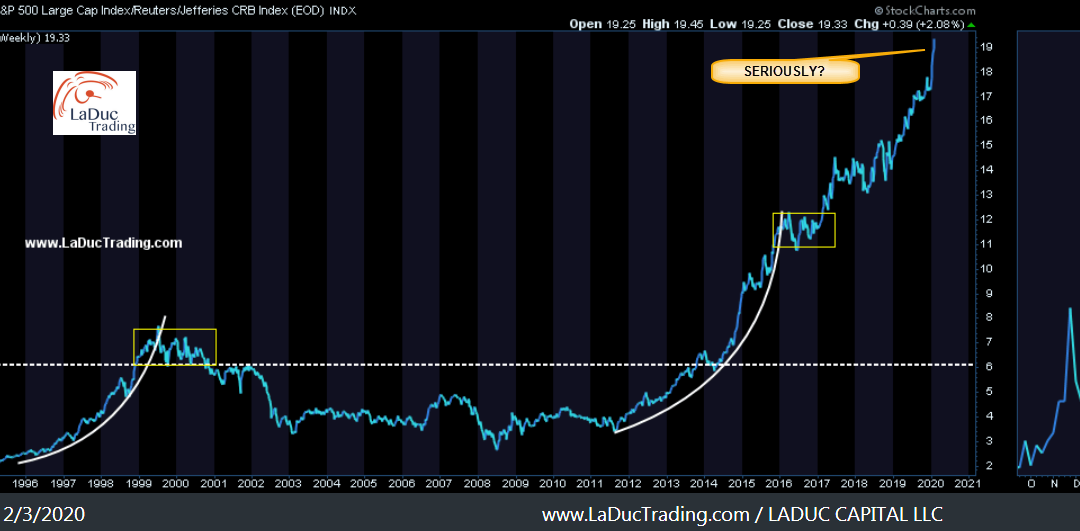
I have recently presented my case that central bank liquidity infusions to stem the economic damage from CoronaVirus could ignite inflation. If so, value stocks would roar back, since so many are tied to the Energy complex. And then a curious thing happened today: both Value (VALU) and Momentum (MTUM) were green in equal amounts […]
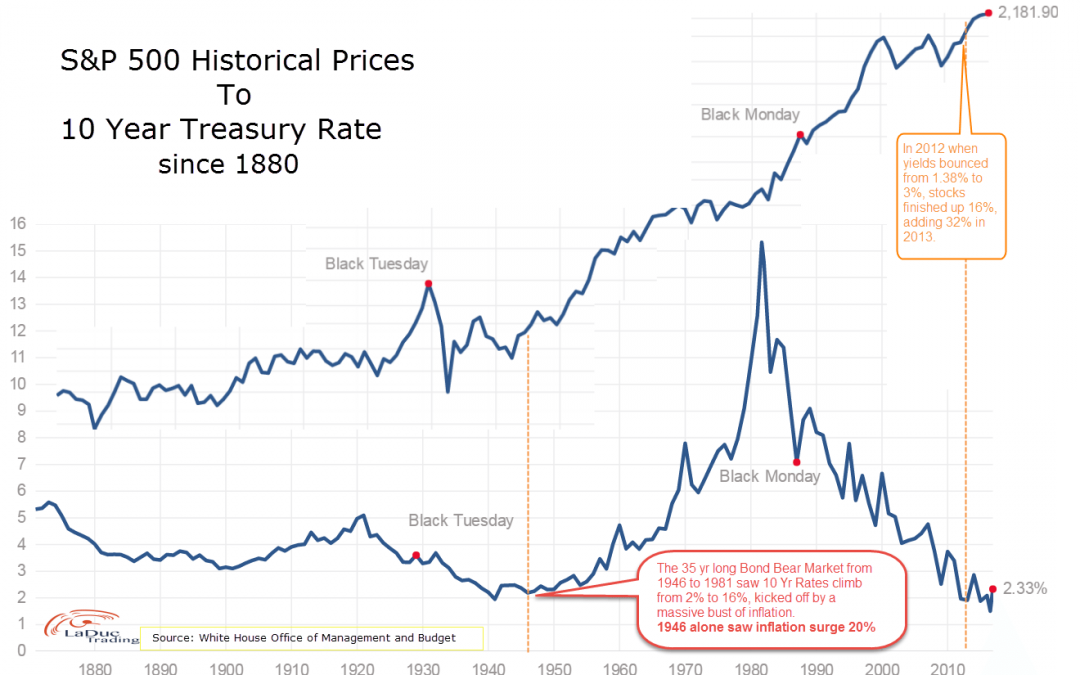
S&P Bulls and Bond Bears Pin Hopes to 1946
Higher Rates Can Be Bullish Interest rates follow very long term cycles. Above highlights a 35 year (1946-1981) bond market, but unlike our most recent 35 year (1981-2016) bond market, they were in a rising rate environment (for more than a blip on a chart). From a...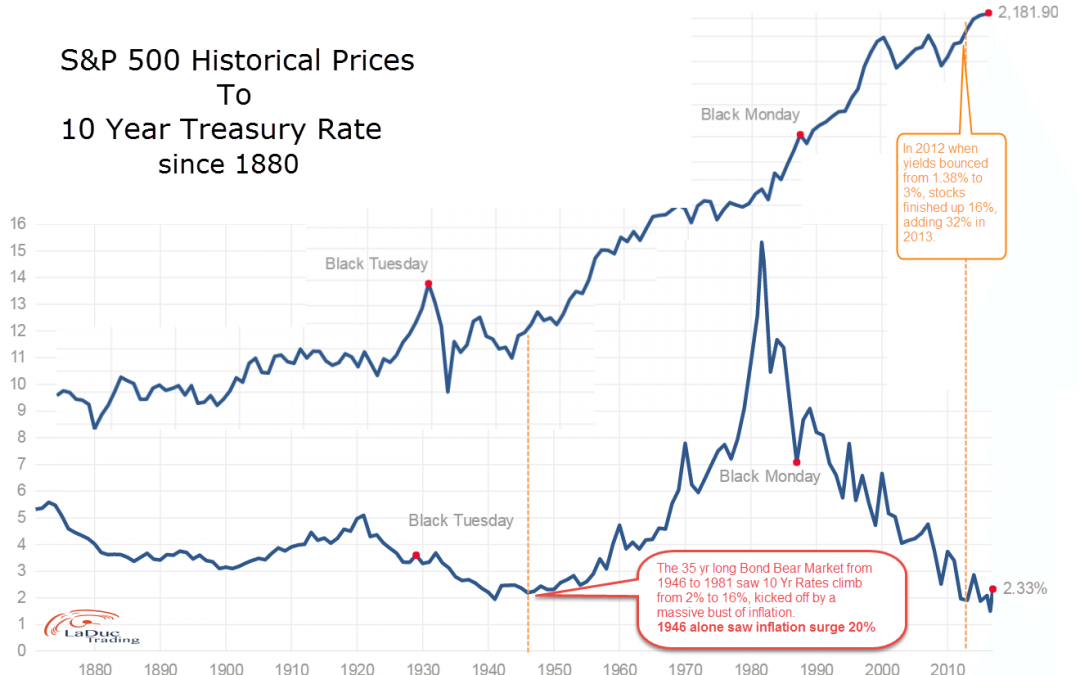
Bond Weary
S&P Bulls and Bond Bears Pin Hopes to 1946 Interest rates follow very long term cycles. Above highlights a 35 year (1946-1981) bond market–but unlike our most recent 35 year (1981-2016) bond market, they were in a rising rate environment (for more than a...