by Samantha LaDuc | Jun 13, 2018
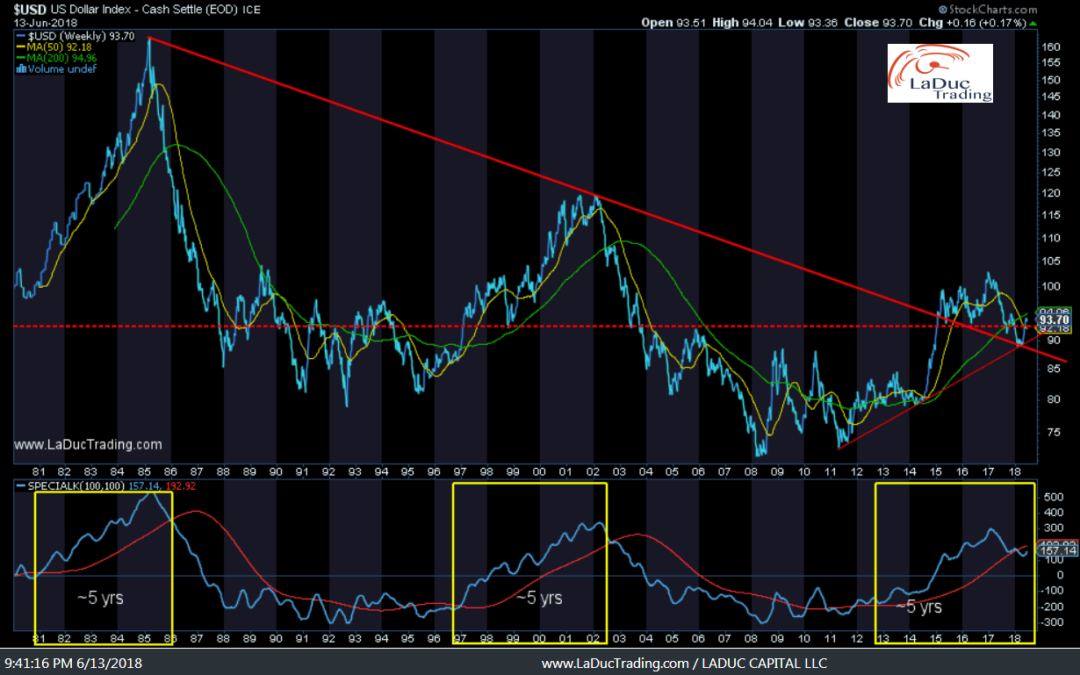
The Dollar and Euro Last time I was on TD Ameritrade April 24th, I was bullish the US Dollar. The chart I posted then had DXY at $90.07. My price target was $95 and it hit $94.97 which happened to correspond to the 200 moving average. With ECB potentially ready to...
by Samantha LaDuc | Jun 13, 2018
The Dollar and Euro Last time we spoke April 24th, I was bullish the US Dollar. The chart I posted then had DXY at $90.07. My price target was $95 and it hit $94.97 which happened to correspond to the 200 moving average. With ECB potentially ready to wind down their...

by Samantha LaDuc | May 21, 2018
This is an Intermarket Analysis chart review which graphically represent relationships (strong and weak) that can foretell how the undercurrents are moving to better identify where stocks/sectors/indices are flowing! You can see (and should see!) my last Intermarket...

by Samantha LaDuc | May 9, 2018
Gold – big picture – is coming into focus as I see a Major Inflection point coming for Gold (and from which trades for Silver, Palladium and Miners will develop). For now, I wanted to address Gold and the main currencies which affect Gold. Macro Matters...
by Samantha LaDuc | Apr 27, 2018
The following article is a part of my Gone Fishing Newsletter that I provide to fishing club members each week to identify macro inflection points and actionable micro trade set-ups. Reflections and Inflections The daily island reversals on the SPY QQQ and IWM on...
by Samantha LaDuc | Apr 24, 2018
EARNINGS AND GDP Earnings last quarter 2017 saw double-digit earnings growth but stocks fell on great earnings – the opposite of late 2016 when the earnings trough showed companies with negative earnings had stopped falling after they reported. So here we are in Q1...
by Samantha LaDuc | Mar 28, 2018
I have no idea what’s going on with these vicious swings, both to the downside then upside then downside, except to say end of month/quarter rebalancing is more eventful than usual. Seriously, the selling is very intense and very concentrated to Tech and it was...
by Samantha LaDuc | Mar 21, 2018
Please Note: I will be attending the Benzinga Women’s Wealth Forum in Boston today – yes in the middle of a Nor’Easter – so I will not be managing my trades at my computer for the Portfolio – my trading platform will be! With that, there...
by Samantha LaDuc | Mar 21, 2018
Please Note: I will be attending the Benzinga Women’s Wealth Forum in Boston today – yes in the middle of a Nor’Easter – so I will not be managing my trades at my computer for the Portfolio – my trading platform will be! With that, there...
by Samantha LaDuc | Mar 20, 2018
THE sell off we are all looking for now may be the type of existential threat to the sector that Cambridge Analytics represents with FB or the fear that Alexa (home) and Uber (car), Facebook (personal) and Google (everywhere) could conspire against us, really....
by Samantha LaDuc | Mar 20, 2018
This is a part of Samantha’s Gone Fishing Newsletter that she provides to her fishing club members each week to identify macro inflection points and actionable micro trade set-ups. Early February of this year, stocks got hit while the VIX had its 2nd biggest...
by Samantha LaDuc | Mar 19, 2018
Reflections and Inflections Recently, stocks got hit while the VIX had its 2nd biggest rally ever, all the while bonds hardly budged. The risk off trade didn’t rotate into currency either. The US dollar has been moving lower while yields have moved up. FX...

by Samantha LaDuc | Feb 18, 2018
This analysis was provided to my fishing club members Sunday, February 11th, to prepare them for a likely intraweek market bounce before the pullback resumes in earnest. This is my version of an Intermarket Analysis chart review which graphically represent...
by Samantha LaDuc | Feb 7, 2018
This is an Intermarket Analysis chart review which graphically represent relationships (strong and weak) that can foretell how the currents are moving to better identify how stocks/sectors/indices will move! You can see my last Intermarket Chart Attack here. Note my...
by Samantha LaDuc | Feb 6, 2018
This is an Intermarket Analysis chart review which graphically represent relationships (strong and weak) that can foretell how the currents are moving to better identify how stocks/sectors/indices will move! You can see my last Intermarket Chart Attack here. ...