Table of Contents
Playbook
My last Intermarket Chart review I primarily wanted to revisit my ‘before’ and ‘after’ charts from my recent market timing calls: Intermarket Chart Attack: 1929 or 2008.
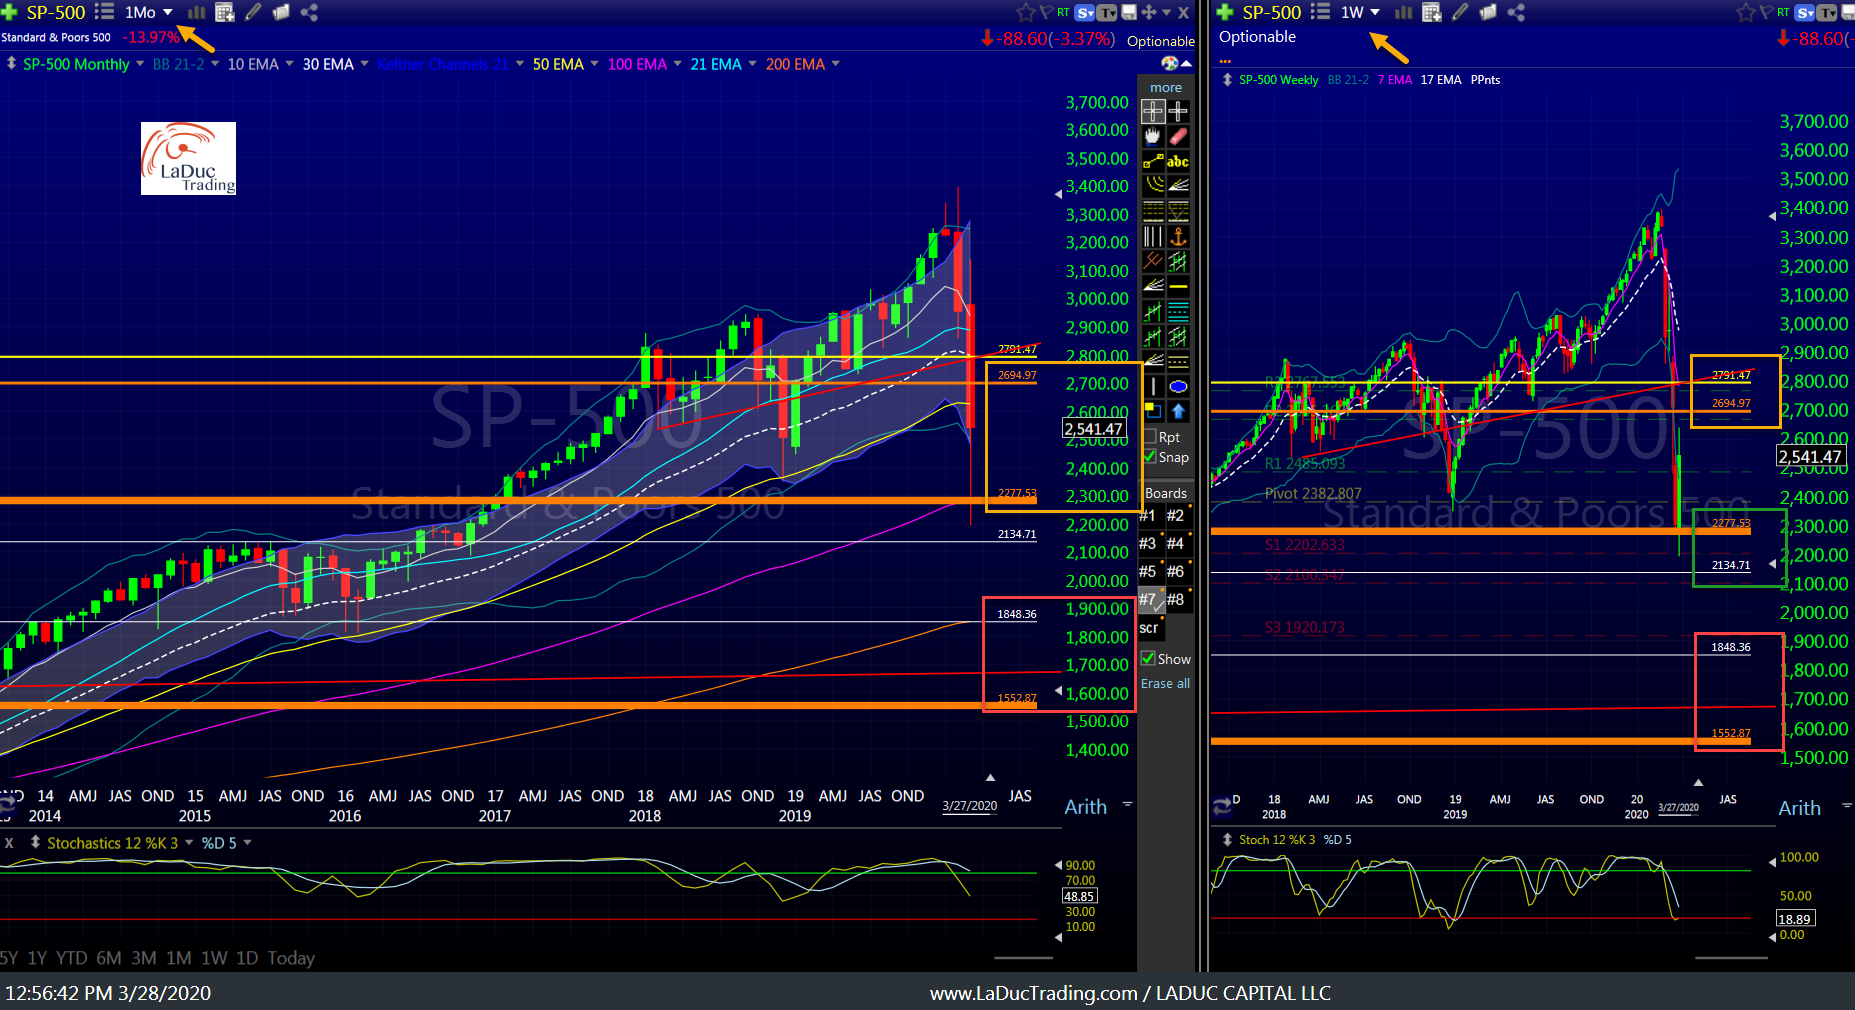
In this post, I want to highlight certain themes for continuation as well as current ‘Playbook’ in charts I am using to guide what I believe will be quite tricky markets next few weeks while market digests big moves. I suspect there will be a strong period of Indigestion that follows as indicated from my SPY Big Picture:
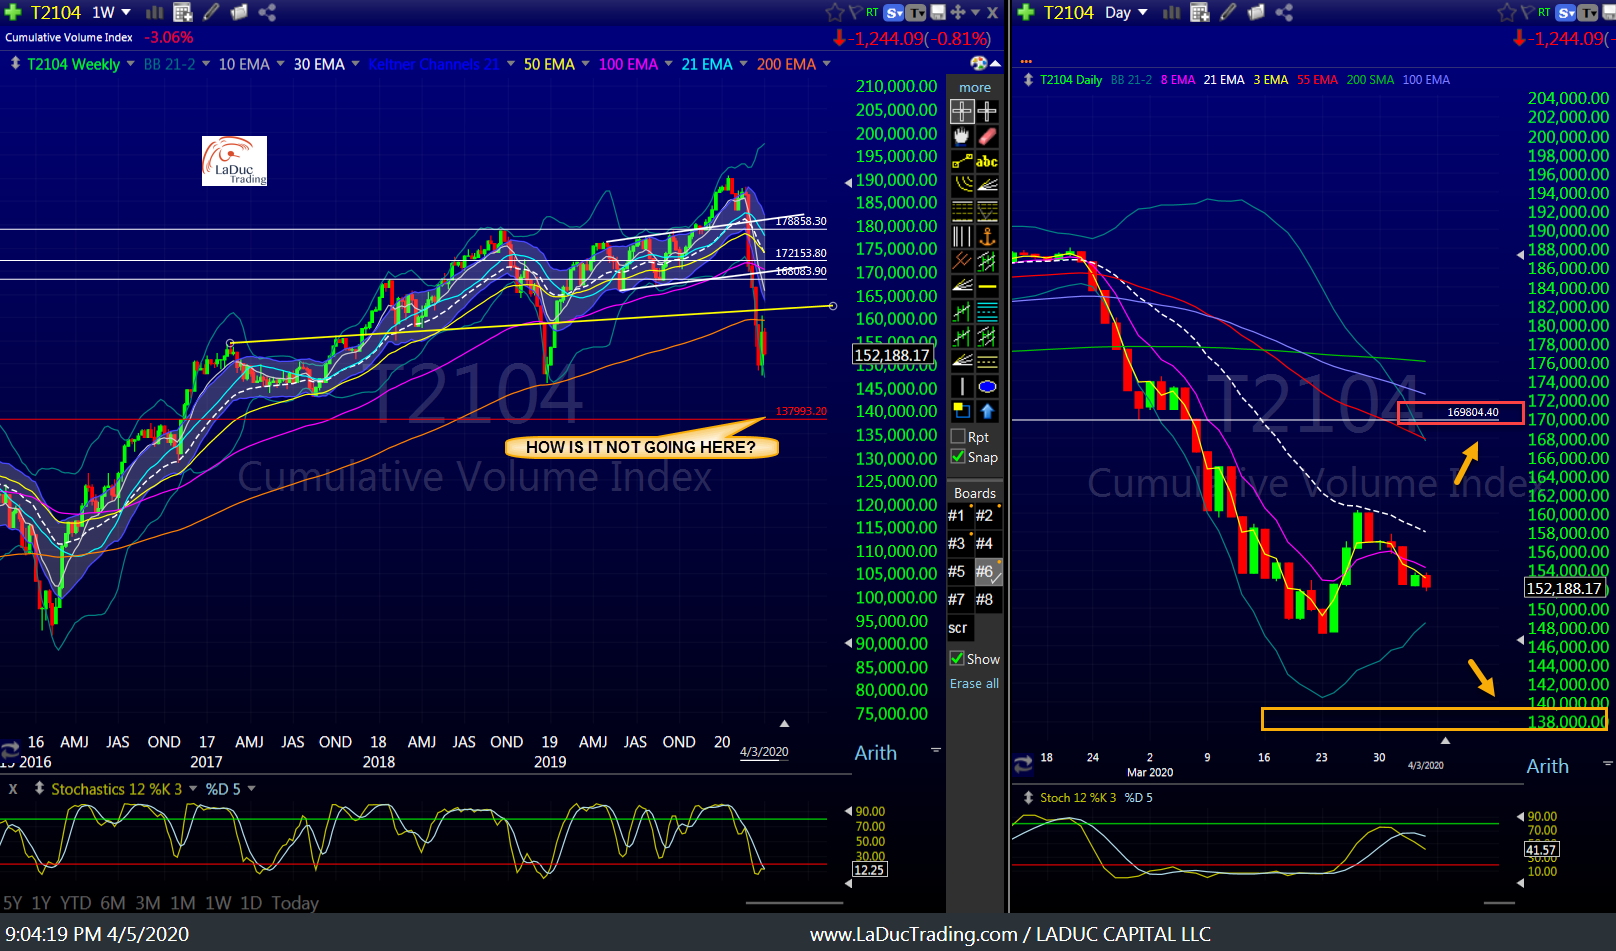
In my live trading room I have been tracking the MASSIVE distribution of selling that has been occurring in this indicator of Cumulative Volume since Tuesday February 25. It has served as a playbook of sorts in alignment with another dozen breadth indicators and in support of my market timing calls that have guided my ability to time The Turn February 18th through Friday March 20th. Here is my estimation of where we are headed in the coming weeks – chop then drop.
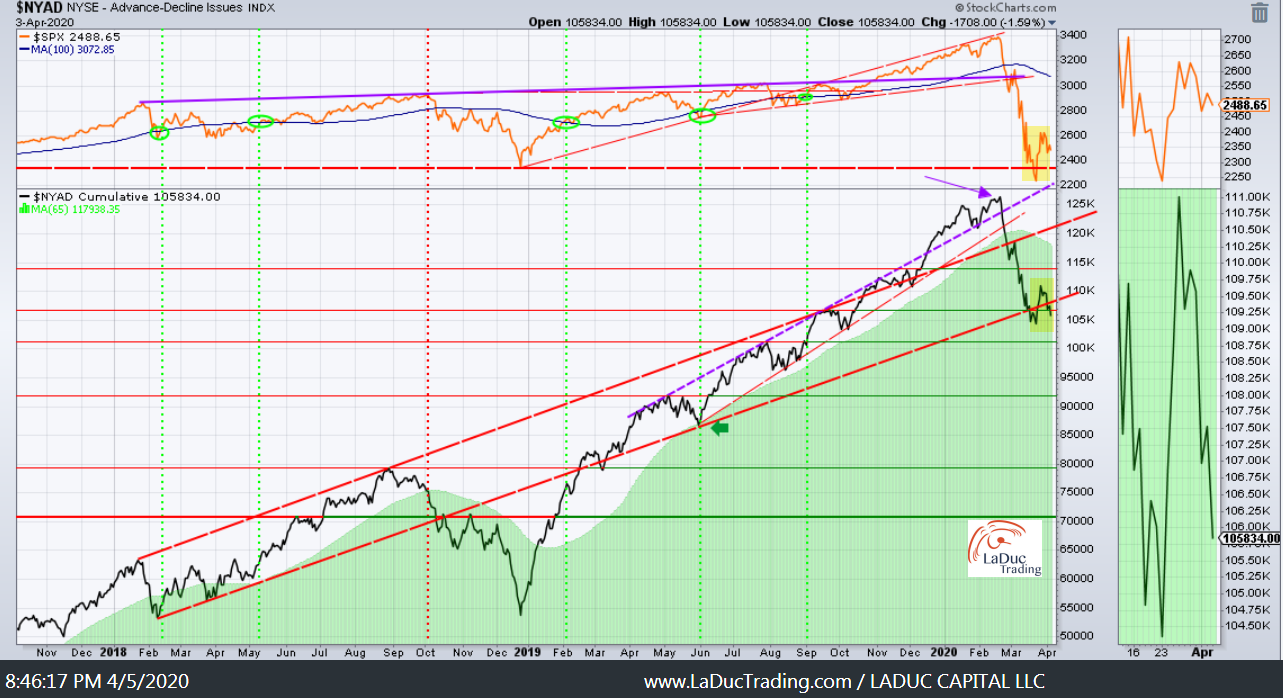
I have shown my NYAD – NYSE advance-decline – chart before so as to also demonstrates how quickly forced and natural sellers can wreck a market.
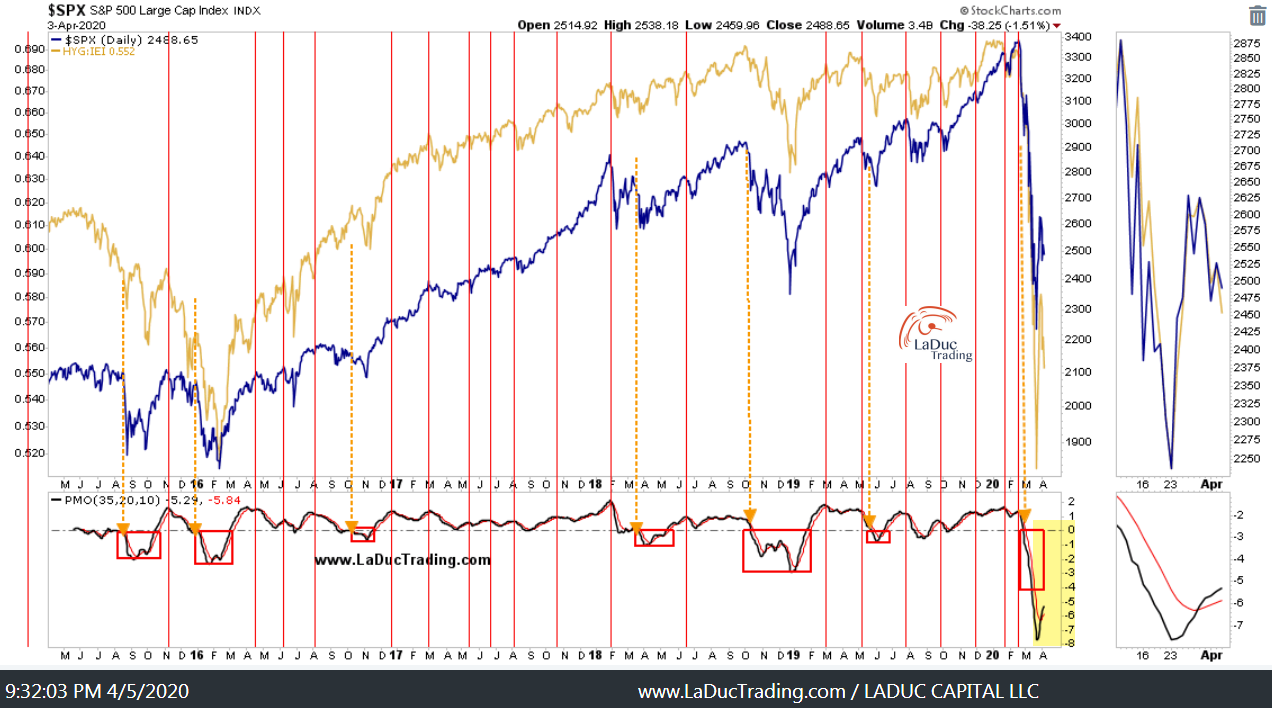
February 26th: Bond:Treasury Ratio Warned: Anytime the HYG:IEI ratio falls below SPX it is a tell something is likely to break. Aaaand it did.
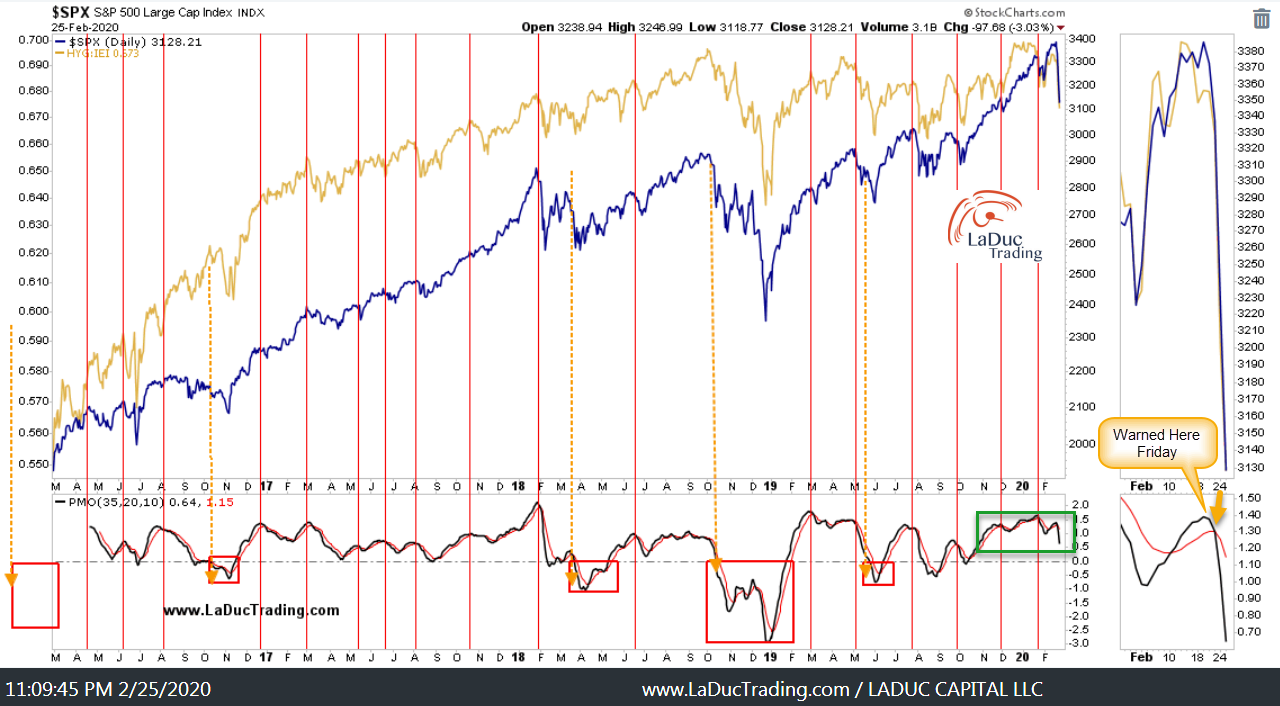
Currently, I suggest it needs time to repair. .Believe it or not, until this bottom panel indicator crosses above 0 (bullish), this chart read is full of indigestion.
NYSE Warned from before February 26th:
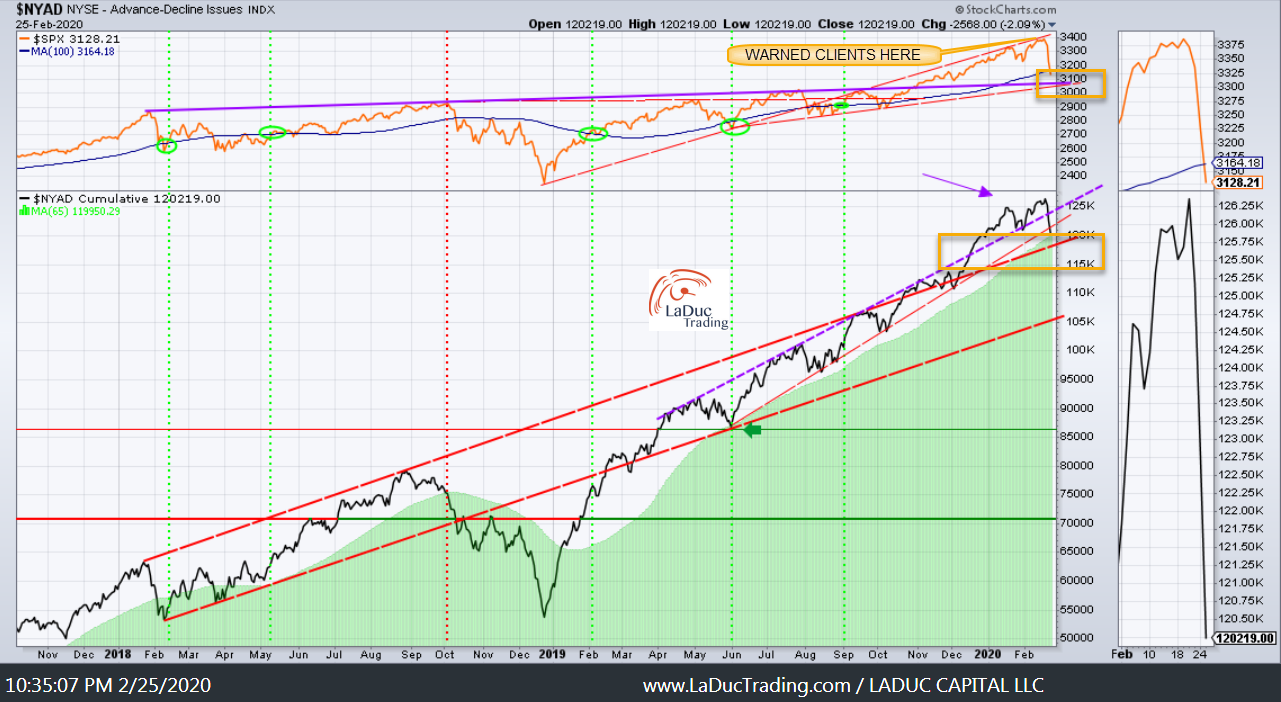
Currently, it is digesting a key level. Above bullish, below bearish.
Market Thoughts
Rationale and fund flows support my chart read:
Morgan Stanley: next 2 weeks will be more tactically challenging
- Past the beneficial flows around month-end re-balancing
- Potential for renewed funds outflows cross-asset
- Past peak market uncertainty but not past peak macro uncertainty
- Earnings seasons will be downbeat
- US covid news will continue to get worse; coasts still 1-2 weeks to peak; rest of US >40 days left to peak
Goldman: reasons to be optimistic
- Monetary stimulus has been swift, targeted, and appears to be almost unlimited
- Fiscal stimulus is now in place to support individuals who are losing their jobs, incentivize companies to keep people employed, and provide a financial backstop to corporates
- China activity has already begun a nascent recovery, providing a lens for US investors on how things may look once the impact of virus mitigation efforts begins to wane
- Pharmaceutical companies remain focused on developing vaccines and treatments for the virus
Goldman: reasons to be pessimistic
- Almost 10 million people filed for unemployment insurance
- GDP growth is poised to fall by an unfathomable 34% in 2Q20 (Q/Q, annualized), with the steepest drop expected in April
- S&P 500 earnings are forecast to fall to $110/share in 2020 with 2Q20 EPS estimated to be down 123%. GS now forecasts a 25% decline in S&P 500 dividends
- Supply chains are intertwined in this world such that even the recovery in China is struggling to maintain a purchase in the most secularly advantaged sector:
- The US High Yield credit market is poised to potentially have to absorb an additional $555bn in Investment Grade downgrades as a huge swath of BBB-rated companies are re-evaluated in the coronacrisis
JPM: Gross exposure has declined across all client types and cumulative trading activity both long and short is elevated:

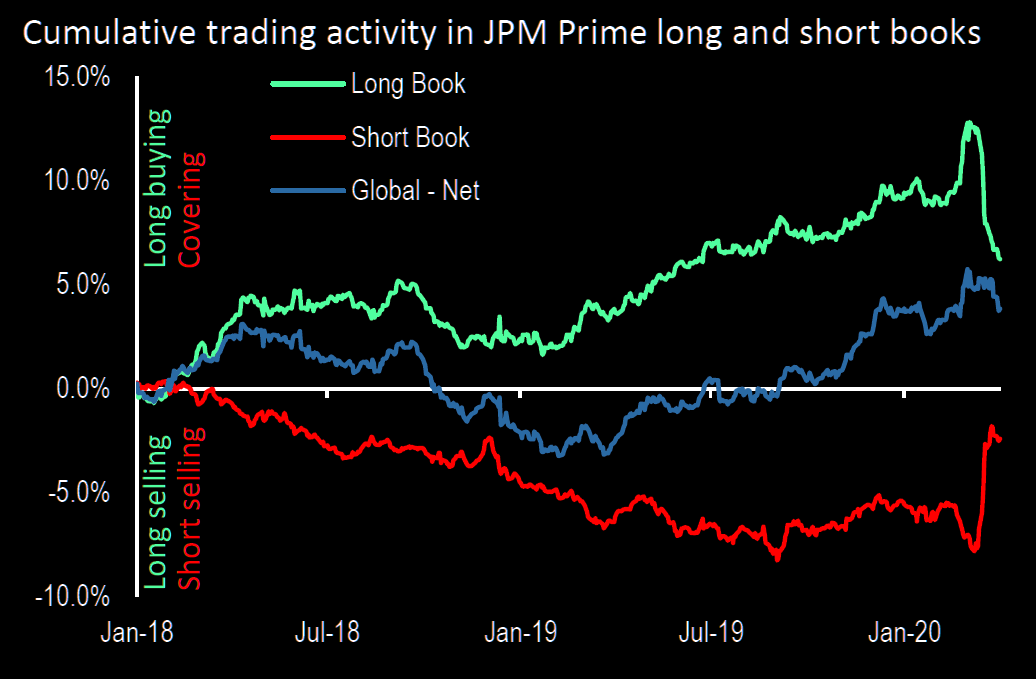
And let’s not forget we are far from out of the woods: This is a health/medical crisis with vicious knock-on effects.
Gold
Given the long-term impact from COVID19 on personal, financial and economic health, let’s revisit Gold.
Gold and gold/silver miners have made a dramatic recovery since they were sold off aggressively with equities mid-March – as warned about in advance given their role as collateral in times of margin calls. Silver has been slow to repair but is trying. Given the drastic monetary intervention efforts by the Fed past few weeks, Gold is holding its value despite a bounce in SPY and especially as physical and paper gold prices started normalizing once again.
Here are three charts that support my bullish view on Gold/Miners:
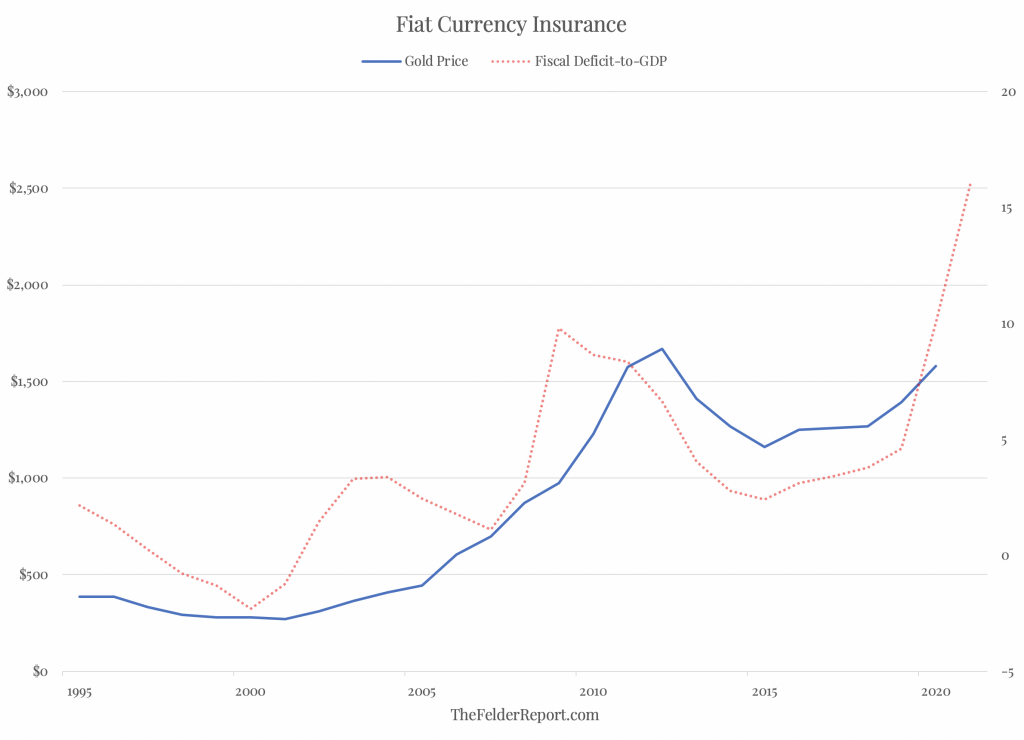
Macro – Given gold prices tend to rise when the fiscal deficit as a percent of GDP is rising, and we surely have that in the time of CoronaVirus, the likelihood that Gold is defended/bid is high.
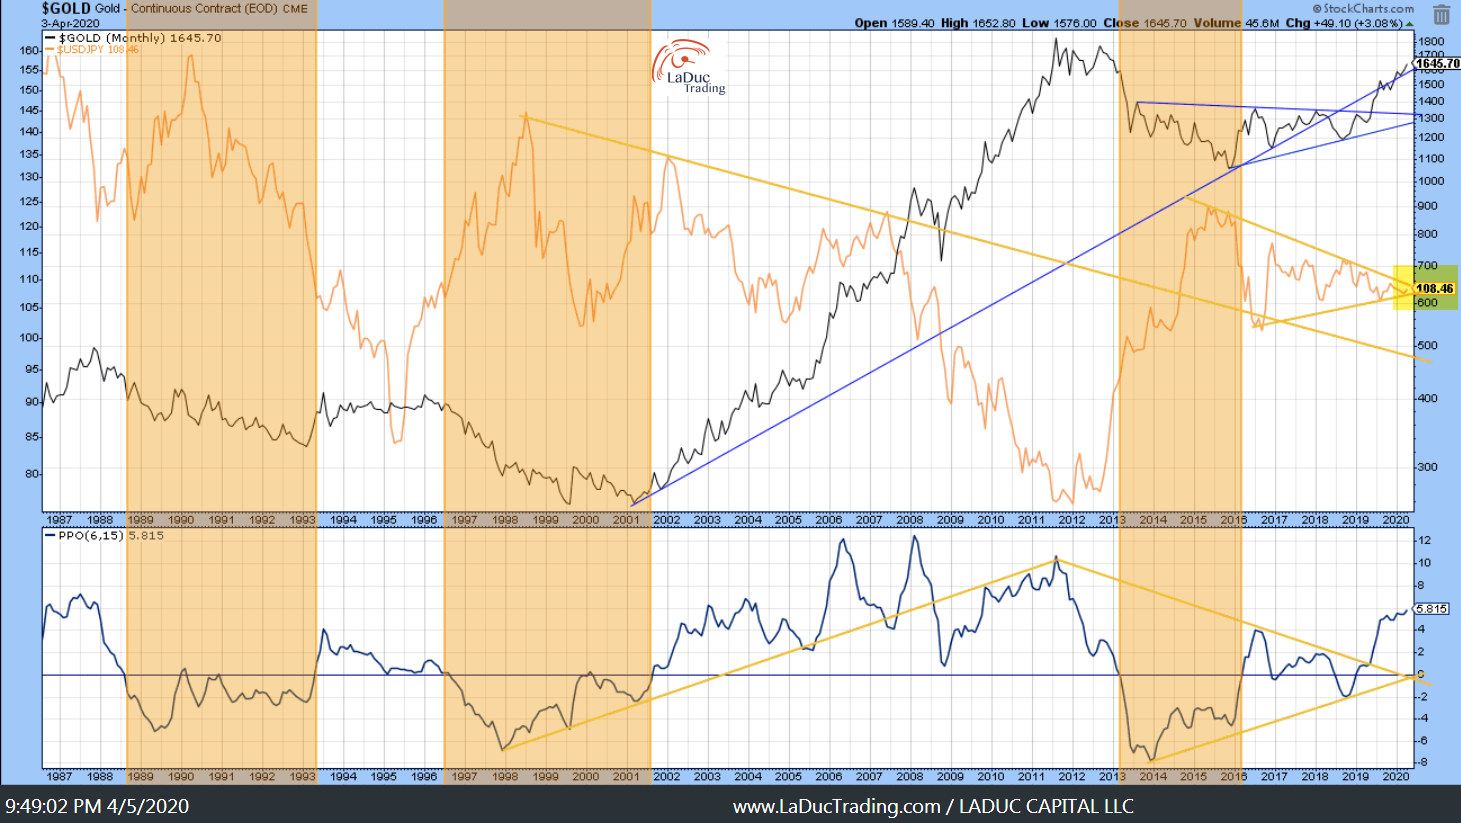
Intermarket – Gold tends to move with bonds and/or Japanese Yen. The following chart represents Gold in an uptrend since ~$1200, inverse to USD/JPY, but a big move looks to be coming in USDJPY as it has been coiling ~$108 for several weeks. The break-out or down will strongly determine Gold’s direction I suspect.
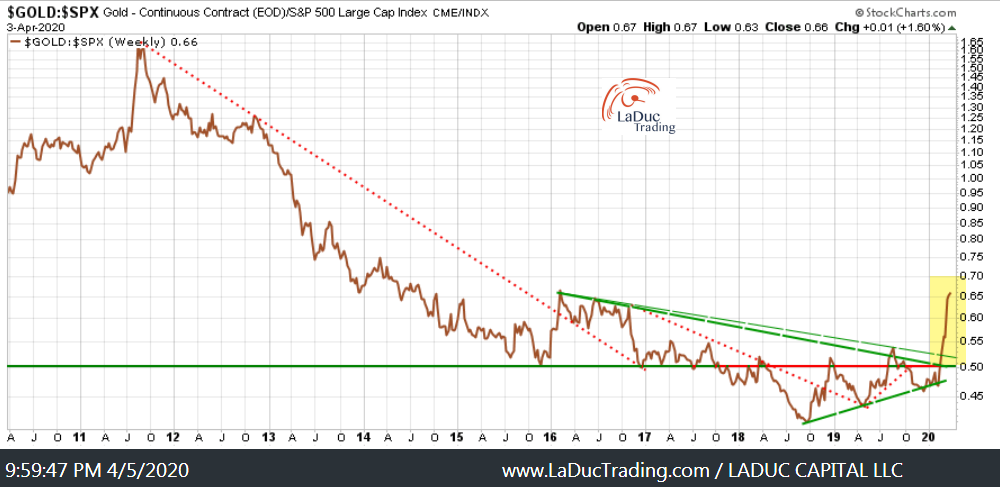
Technical – Back on February 26th:
“The MOST interesting chart to me is the break-out of this Gold to SPX ratio. Above is massively bearish SPX:”
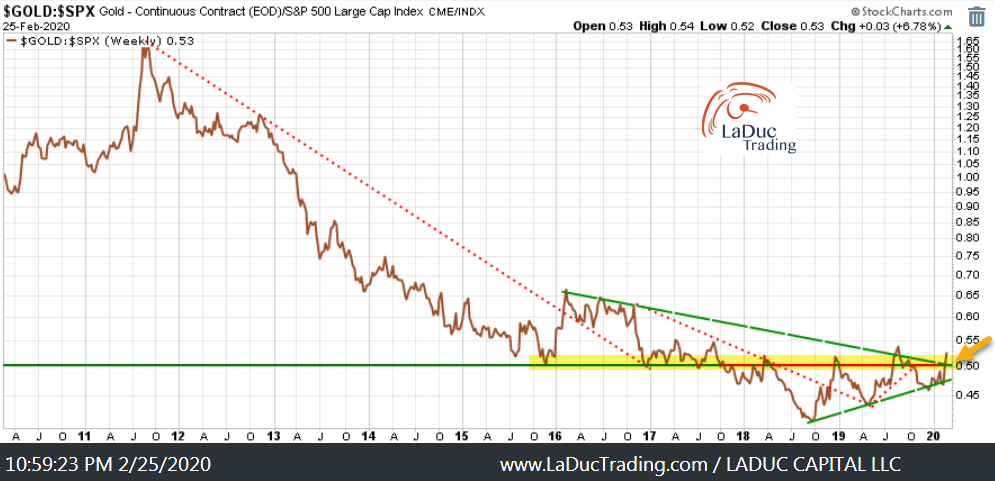
Currently, Gold relative to SPY as demonstrated in this updated GOLD:SPX ratio chart illustrates that the correction in SPY, and the support in Gold, will likely continue, but not without some likely periods of digestion.
NYSE has been my ‘playbook’ Tell
Back on February 26th: “NYSE Top Signaling Still Warns:”
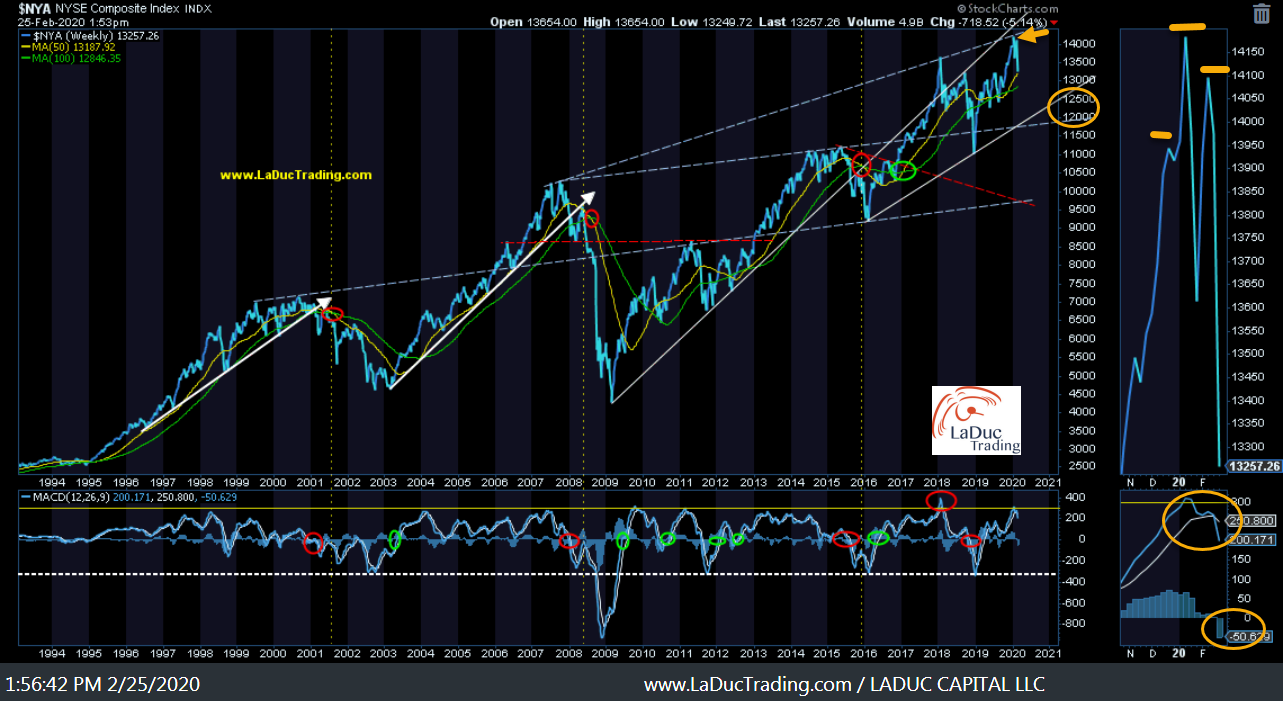
Currently, NYSE Composite has a little support at 2016 lows but has not yet bottomed in MACD lower panel and turned.

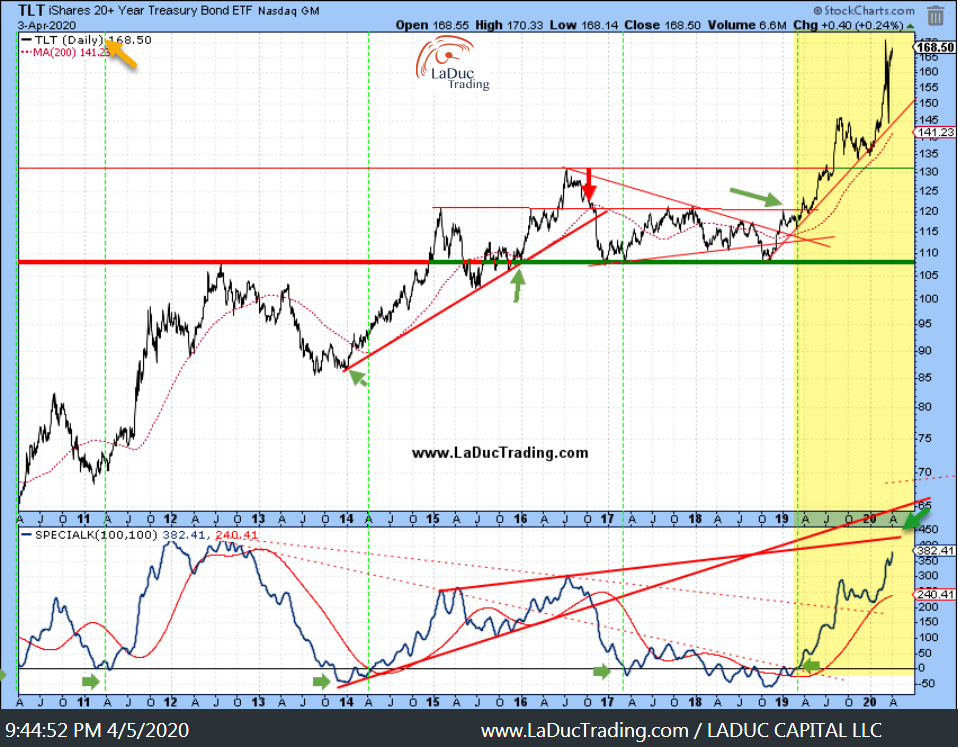
Bonds
As suggested strongly past two weeks since the big, sudden sell-off mid-March, Bonds continue to get defended despite record outflow of Treasuries by foreigners last month. Fed as buyer of last resort ensures “lower for longer” yields.
Note: This is my favorite ‘playbook’ chart for TLT which helped me time The Turn higher January 2018!
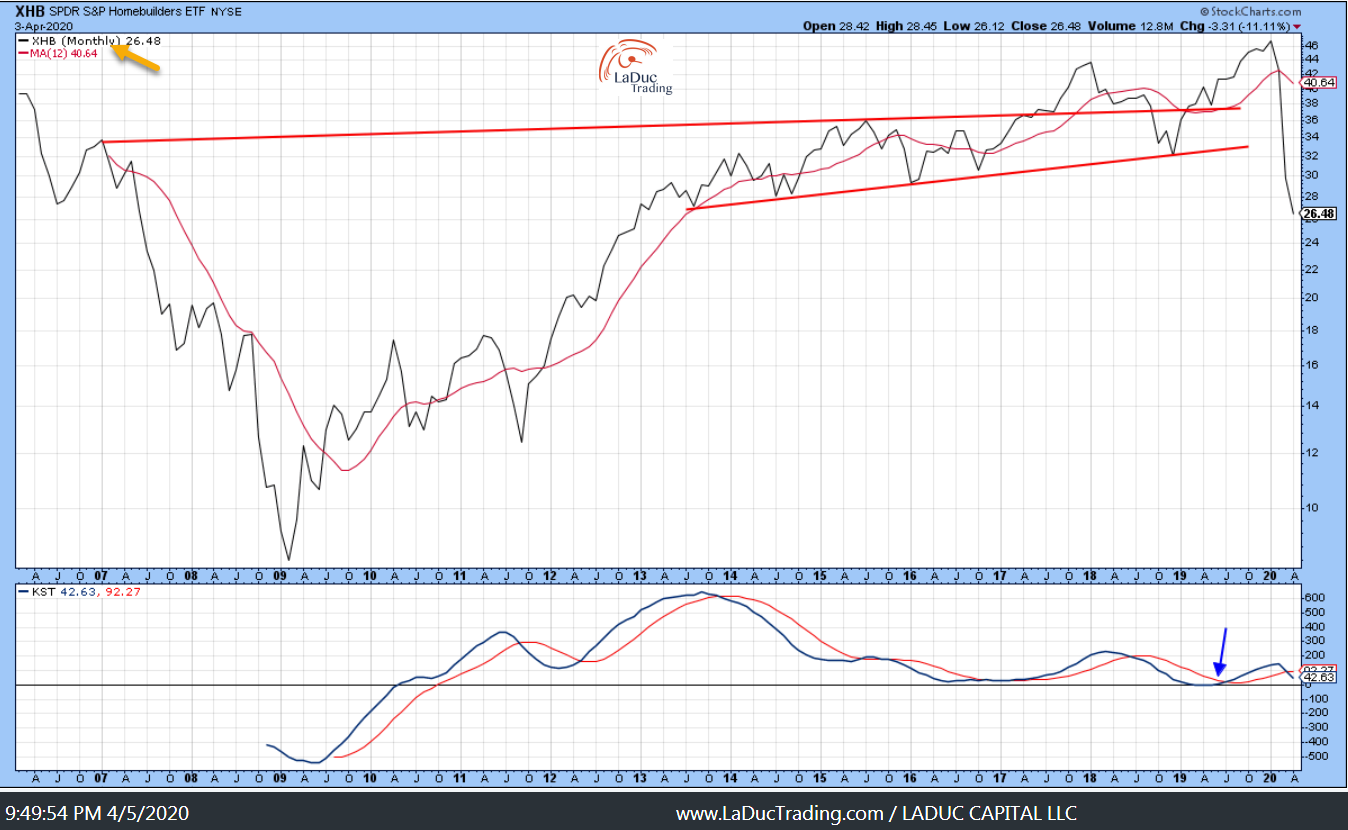
Sector Ideas Short
Homebuilders
On US soil, it will be hard to bottom-fish housing until after we get through the worst of Coronavirus and have a better feel for Commercial and Residential mortgage markets. It could be years IF the cycle turns. At the very least, it will be months as CoronaVirus dampens consumer spending and investments.
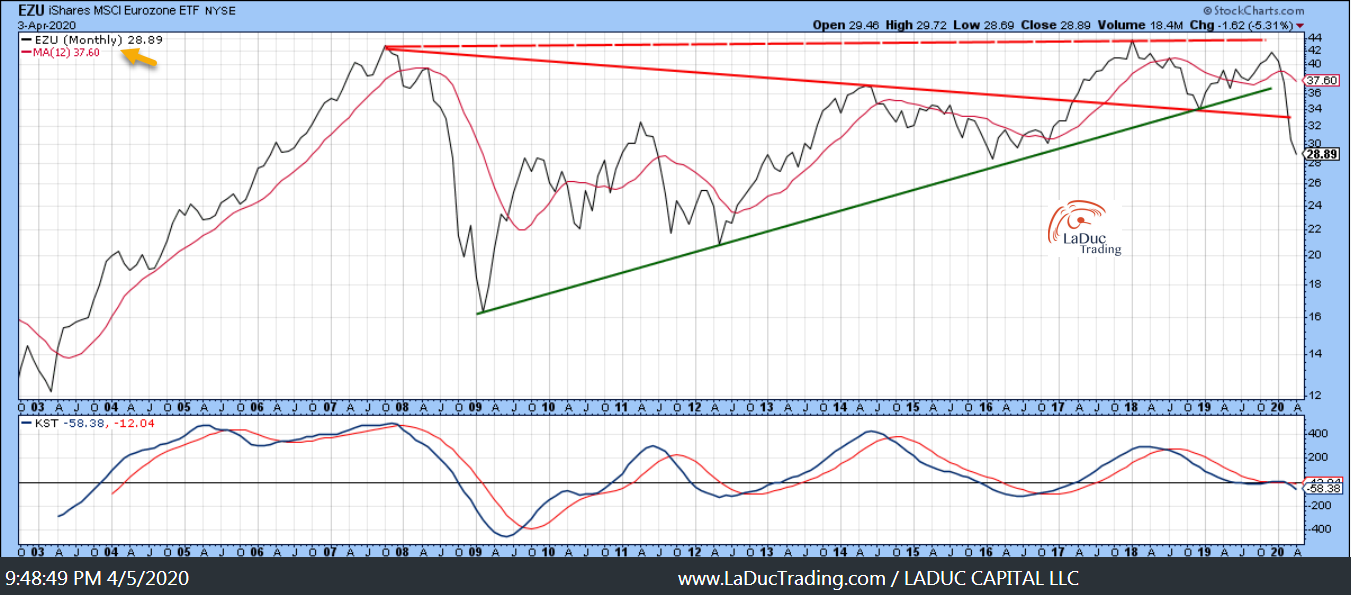
Eurozone
You don’t need me to tell you what the Euro looks like these days… Well, here is EZU again. It broke both both trend-lines of support.
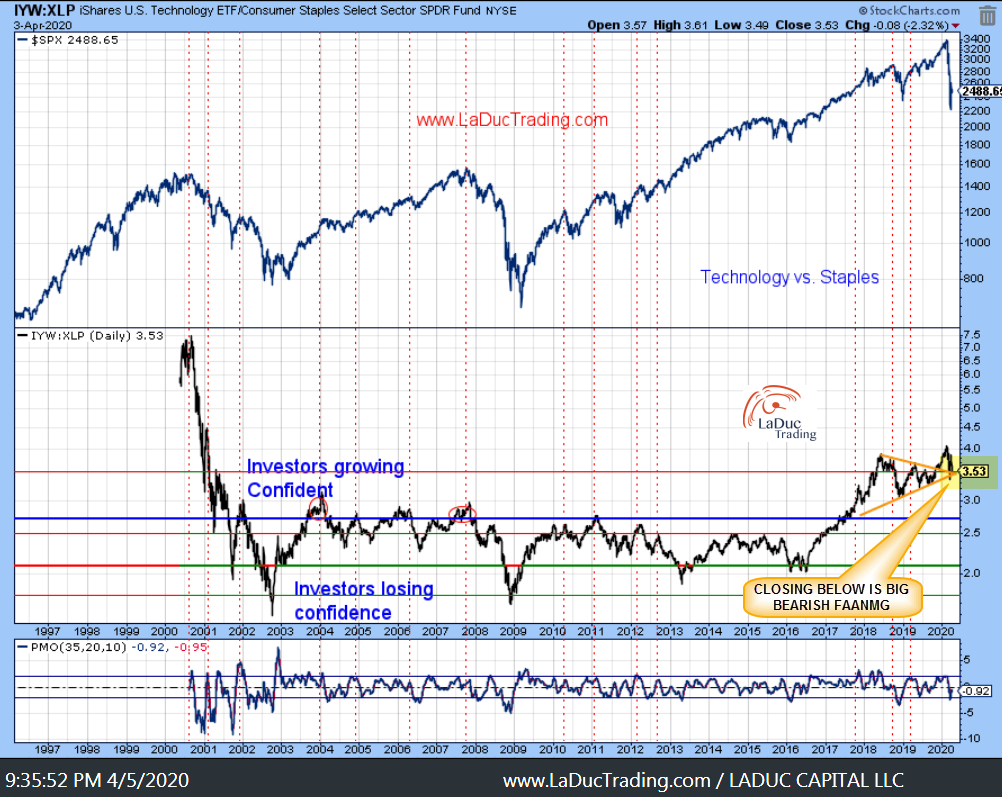
Technology To Staples Rotation
I have been waiting for this one to trigger. Getting close… and when it does, I suspect FAANMG stocks along with Semis will have a bit of indigestion to process.