This coming week will be the 10-year anniversary of when the S&P bottomed out at 666 amid the financial crisis. We hit $2940.91 on September 21 of last year, a 341.59% advance!
But it took only two months – the best two-month rate-of-change run in history – for the market to advance from $2346.58 to $2813.49, a 19.9% advance!
So why am I calling this a Bear Market Rally amidst potential Korean denuclearization and China Trade War resolutions, which could/should be tremendously bullish? Because I don’t think either President has any incentive to settle this sooner rather than later – think 2020 elections – and as such the market will likely Churn lower into this potential bullish catalyst while volatility will percolate on global growth slowdown scenarios, earnings margin contraction and government debt deleveraging fears.
Long Story Short: I just see a big-ol’ Chop-Fest this year into 2020 despite the hope of a Trade Deal and Powell Pandering to ease.
“Air Is Thin” Theme Continues
Leading up to this past Friday’s trading session, the markets appeared to be exhausted (.2% range for the SPY last week) and have been trading in overbought conditions for the better part of the last 10 trading sessions.
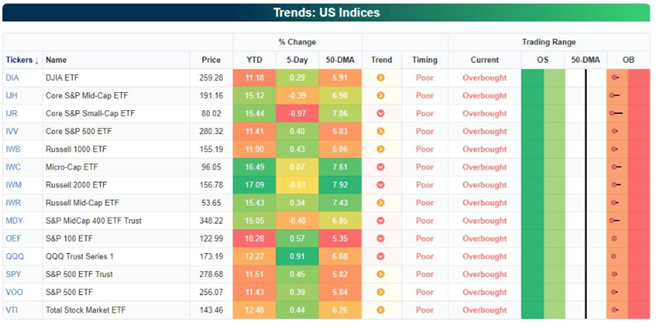
From Monday through Thursday, SPX and its peer indices sold-off into the closing bell. I made note of this in my Live Trading Room: The indices have gapped up most mornings and sold off into the close. Friday’s rally was the exception – caused potentially from 1st of month fund flows (more on this below). Even with the rally on Friday, the Dow Jones Industrial Average (DJIA) finished lower for the week as the transports began to break trend. When it was all said and done for the week, the Dow slipped 0.02%, ending its winning streak at nine weeks while the Nasdaq rose 0.9% and the S&P 500 rose 0.4 percent allowing them to claim the 10-week winning advance. Of most interest was the close on Friday wherein the S&P 500 broke and closed above the critical 2,800 level.

Liquidity, Bank Reserves and Burning Beds
It is reasonable to deduce that the rally in global equity markets has largely come on the back of a more dovish Fed, liquidity injections from the Peoples Bank of China (PBOC) and to some degree improved liquidity offsets between the Fed and the U.S. Treasury. With regards to the “offsets”, while the Fed continues to unwind its balance sheet monthly, the Treasury Department is dumpling liquidity into bank reserves. This was demonstrated again this past week when on Thursday the Treasury Department dumped $60Bn of liquidity into bank reserves and on Friday dumped another $90Bn.
What does this mean? I went to Twitter to find out:
Reserves injected back in
$XLF system thru liability side of B/S incrementally/temporarily improves Dealer LCR/RLAP Liquidity Coverage Ratios enabling big reversal of GC Repo rationing process at yr end by$JPM & 2 lesser extent$BAC 2 all their poor$EUFN &$KRE step kids#PPTThink of it like the Fed & Treasury taking out
$JPM &$BAC ‘s Bridge Loans before their obligors metastasize into the Ohio Mattress Company.$TLT$XLF
2)
$JPM really only bank in position to ration its b/s coz 64% of HQLA in cash & can stave off$XLF liquidity runs as liquidity seller in RRP 2 finance real liquidity &$TLT needs 4 RLAP/LCR window dressing 4$EUFN &$KRE..JPM controlled 46% of RRP/Fed Funds Sold at year end.3) While admirable it brings up huge concentration issues in banking system at times of stress w even a tiny change in size of Fed Assets/QT sets off PPT…what happens in recession when
$JPM is fighting their own battles to sell down credit book? Not in the same cash position.4) Pre Crisis there was a “Corridor System” aka No QE or Free Markets where Liquidity was disparately allocated by a non concentrated system of banks that lent excess liquidity to each other overnight without huge 40% Fed Funds Basel Risk Weights & horrible LCR run off scores..
5) Now we have QE or a “Floor System” that is broken by even slightest bit of QT. Easy 2 get into by printing reserves/deposits/hyper asset inflation but we now know the system doesn’t function > 2.4% IOER w/o massive economic & market collateral damage. Damage is already done.
$XLF & especially$KRE deadly scared of OIS flattening & inverting next yr on weaker growth while pulling back on credit. Demand for Receiver swaps is off the charts again 2 now neutralize Asset Sensitivity…if that ain’t a sign of#HotelCalifornia not sure what is.#ZIRP#QE.
And with that, this is what I do on weekends: collect data points, connect dots. In this case, I may not be fluent in the above native language, but I get the gist: Something smells. It’s a #BurningBed and it’s inside the Hotel California.
Can We Grow Our Way Out?

GDP is decelerating, rapidly. Goldman sees Q1 GDP at +0.9%: from 4.1% in Q2, post tax cuts. If that wasn’t bad enough, here’s what works against GDP from the inside out:
- Credit Cards/Revolver – $1.2T
- Student Loans – $1.6T
- Auto Loans – $1.2T
- Lev Loans/CLOs – $1.2T
- Pvt. Credit – $770B
- CRE – $2.2T
- BBBs – $3T
- $HYG – $1.2T
We have an indebtedness of ~$12T+ of problems = 65% of nGDP
Paying Bills Is A Bear
Federal government has hit its borrowing limit – today – not clear when lawmakers will raise (or suspend) the debt ceiling
— West Wing Reports / Paul Brandus (and on Mastodon) (@WestWingReport) March 2, 2019
The Fed and the U.S. Treasury Department are making life very difficult for the permabear camp in 2019 – at least so far, but soon, the U.S. government will need to raise the debt ceiling and this topic will prove a battleground for legislators. Back in 2011, the mere threat not to raise the debt limit caused panic in financial markets and led Standard & Poor’s to downgrade the nation’s credit rating for the first time ever.
Also, liquidity measures don’t necessarily offset the risk of brisk selling that can accompany overbought conditions and the potential for market exhaustion, resulting in a retracement in the equity markets. It is important to understand that just because markets are overbought and most indicators have reached an extreme level, this doesn’t suggest that the market will necessarily fall apart immediately. Unless you subscribe to my Ides Of March Warning.
Other indicators suggest further upside in the market is relatively limited compared to the downside risk. At a minimum, historically the market takes a breather when reaching extremes. At a maximum, we are in or soon facing a recession.
“Every time the three-month average unemployment rate exceeded its six-month average at cycle peaks over the past 50 years — like it did in January — the U.S. economy has experienced a recession.”
“If the economy is, in fact, slowing and that is what has sidelined the Federal Reserve, then what we are witnessing at the moment is a bear market rally” Danielle DiMartino Booth of Quill Intelligence
That Time Of The Month Again
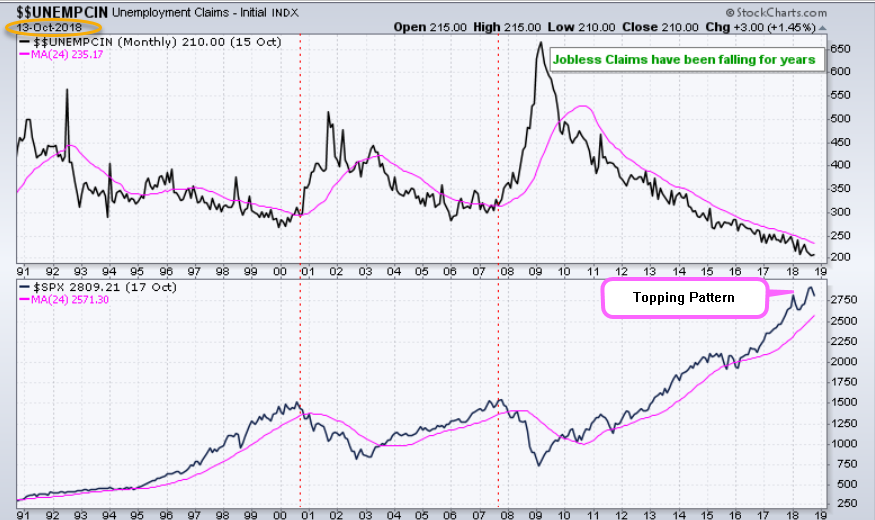
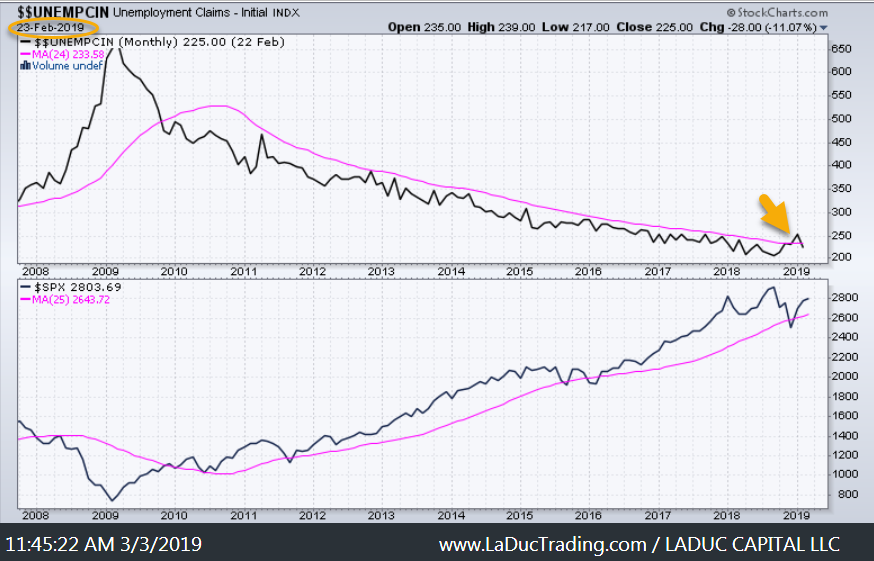
I sent this #UnemploymentClaims chart to clients in October after calling the Oct 3rd market top.
My chart note to clients then: “Flat yield curves and full employment (<4.5%) are very, very rare. In the last 18 years we had it for basically six months: first half of 2007. Before that was first half of 2000. That combination has historically been incredibly toxic to stocks.”
My warning then as now: Topping Pattern in play – likely Head&Shoulders. Claims that get/stay > pink line (24M) are no bueno!
We get our next look at Non-Farm Payrolls this Friday the 8th…180,000 is expected. The all-important wage inflation data will be released alongside the NFP data. Inflation data would certainly be a catalyst for a market pullback.
Hedging Their Bets
Exhaustion is not necessarily a “sell signal”, as the timing of a market retracement is often unknown and to a great degree demands a catalyst. Dow Transports have been lower for 6 trading sessions in a row. This might be the first sign that the market is preparing to turn in the near future. The idea of expanding risk versus capping it is what is front of mind with portfolio managers with respect to current market conditions. Most portfolio managers have taken to hedging their long portfolio in the past week. During Wednesday’s trading session alone, there was stealthy Put buying in the SPX options markets.
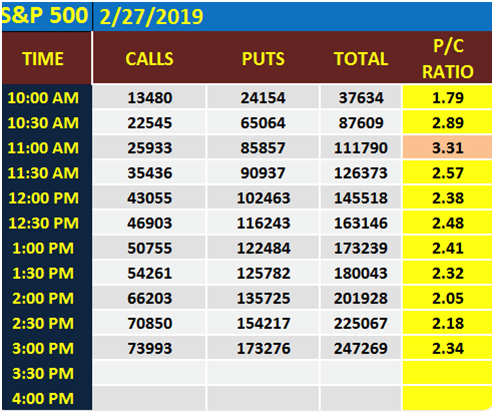
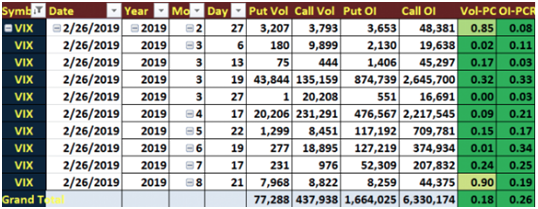
The volume inside the VIX options market exploded this past week. I noted a particularly large April VIX Call Spread bought tied to a very large April VIX Put Spread sold. These folks are doubly bullish Volatility, doubly bearish S&P. The VIX actually finished higher on the week, but only modestly rising .44% for the week and finishing the week at 13.57. There is still time to seek protection, lighten up portfolios or buy outright puts on the market/stocks and calls in volatility.
Markets persisted with oversold conditions for 10 trading sessions in December 2018 and have persisted with overbought conditions for 10 trading sessions through the end of February and into 1st trading day of March 2019.
Is Sentiment Priced In?
According to FactSet data, the S&P 500 is expected to express an earnings recession in Q1 2019.
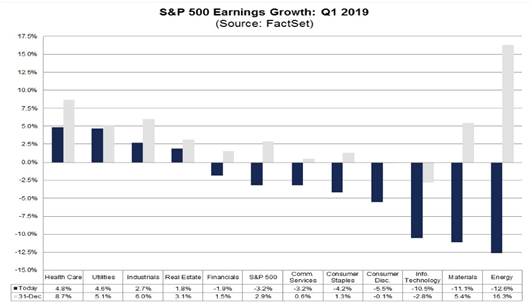
- For Q1 2019, analysts are projecting a decline in earnings (-3.2%) and revenue growth of 5.2%.
- For Q2 2019, analysts are projecting earnings growth of 0.3% and revenue growth of 4.8%.
- For Q3 2019, analysts are projecting earnings growth of 1.9% and revenue growth of 4.6%.
- For Q4 2019, analysts are projecting earnings growth of 8.5% and revenue growth of 6.2%.
- For CY 2019, analysts are projecting earnings growth of 4.1% and revenue growth of 5.1%.
With earnings growth expected to come in at roughly 4% for the year, much of the annual gains may already reflect some of the more positive themes for 2019. Those themes include a Fed pivoting from hawkish with rate hikes to dovish with no rate hikes. Keep in mind that in the month of March, the Fed will release their dot-plot chart forecasting rate hikes or the lack thereof.
Another theme in the bullish market sentiment is that the market may have already priced in a near-term trade deal between the U.S. and China. Ultimately, the market needs to see some improvement in the Chinese economy going forward. New loans in China surged to a record high in January and analysts say it could be a sign that government stimulus is “finally kicking in,” which may be good news for the economy.
Jian Chang, chief economist for China at Barclays, said that credit has expanded “quite significantly” and she expects economic growth to pick up in the second-quarter, after bottoming out in the current first quarter.
Such a scenario depends on “more policy easing from the Chinese government,” Chang told CNBC on Tuesday — a view echoed by other economists who say the government will likely accelerate stimulus to boost economic growth.
It seems, in short, that much of the YTD market gains are a result of a positive outlook and as we know, sentiment can change quickly.
Ides Of March
I have had an #IdesOfMarch Sell-off thesis predicted since back in mid-Dec and wrote about it again to clients in February. Now, as we enter March, two more data points from Nomura’s McElligott turned up this weekend – “higher sell pivot” levels + extreme $SPX Deltas – to further support my call to Beware The Ides Of March
The punchline for a potential “Ides of March” moment is this: if we see the seasonal post-serial options expiration / quad-witch rally-then-pullback phenomenon occur (as has been the median outcome over the past 25 years), which this year could look even more exaggerated on account of the extreme $Delta / $Gamma currently seen in SPX / SPY / QQQ (Consolidated SPX / SPY $Delta is currently 96th %ile and crowded “Growth” proxy QQQ $Delta is currently 97th %ile while $Gamma is 89th %ile), it would then converge with the “demand vacuum” of the onset of the “corporate blackout” window (75% into blackout by 3/19/19) at the same time alongside a mechanically-driver “higher sell pivot” levels in the 1Y CTA model for both SPX and NDX which could potentially dictate outright SELL flows—thus, we could have the makings of a “March Surprise.”
3. Current Extremes (Outliers Revert…)
- Consolidated SPX/SPY $Delta is currently in its 96th %ile (6Y lookback), while $Gamma is 68th %ile and growing.
- Still very crowded “Growth” proxy QQQ $Delta is currently 97th %ile, while $Gamma is 89th %Ile
4. A mechanically-driven “higher sell pivot” levels in the 1Y CTA model for both SPX and NDX which could potentially dictate outright SELL flows. (Never thought of that!)
So that’s the Equity Bear game-plan. What about Bond Bears?
They need a catalyst and I might have one or two or three:
1. Inflation is Percolating
2. $USDCNH looks to reverse /Yuan devaluation = USD Bid
3. Term Premium Unwind is a Yuge Risk
This “universal love” for Bonds could become an issue if we were to see any global upside data surprise, especially on the inflation-front. Three days does not a Trend Reversal make, but this would confirm what I saw in the chart last week which prompted my TLT short position: a wedge pattern in $TNX about to break up: ✅. Still, my chosen narrative supports a further #RateSpike then #VolatilitySpike caused by #USDollarSpike which causes $EEM to panic + $SPX to sell off.
And Why? Because ultimately, Volatility in U.S. government debt is the foundation block for all other volatility.
Thanks for reading and please consider joining me in the LaDucTrading LIVE Trading Room where I take macro and market-moving news, give it context, and recommend trade ideas from it. For additional education, I provide my LIVE Trade Alerts from Interactive Broker to clients interested in my Value and Momentum stock and option plays.
At LaDucTrading, Samantha LaDuc leads the analysis, education and trading services. She analyzes price patterns and inter-market relationships across stocks, commodities, currencies and interest rates; develops macro investment themes to identify tactical trading opportunities; and employs strategic technical analysis to deliver high conviction stock, sector and market calls. Through LIVE portfolio-tracking, across multiple time-frames, we offer real-time Trade Alerts via SMS/email that frame the Thesis, Triggers, Time Frames, Trade Set-ups and Option Tactics. Samantha excels in chart pattern recognition, volatility insight with some big-picture macro perspective thrown in.
More Macro: @SamanthaLaDuc Macro-to-Micro: @LaDucTrading