This is one heck of a click-bait title. Since it’s for loyal clients, I figured I would go for it because you know that’s not my character. You know and I know that even if I might have a few good market timing calls, Flash Crashes are wicked rare and even more rare to time. But here I am – transfixed with a chart that I have presented many times that may actually be projecting a big market drop – and soon.
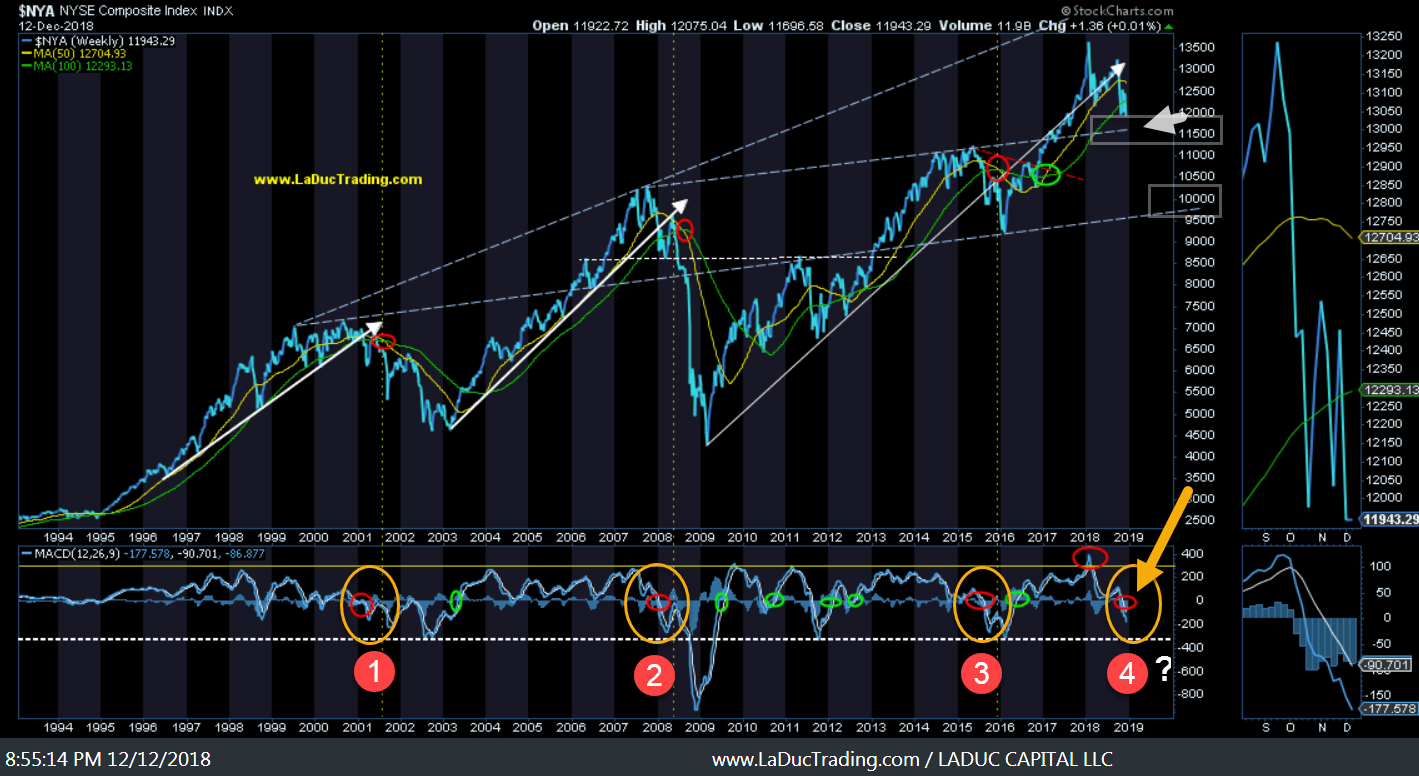
This is the NYSE Composite Index – on a Weekly timeframe. Look carefully at the red circles – both top panel red circles which indicate a 50/100 EMA crossover and bottom panel which indicates a MACD rollover below the zero line. Oh, except for that one EXTREMELY OVERBOUGHT spike in early January which is what I used to call the January Swoon ;-).
Point of this exercise is to have you focus in on the yellow dotted lines that follow the red circles in the MACD box. Do you see how the 50/100 EMA crossover occurs with a severe market drawdown or waterfall? And how the MACD rollover below 0 foretells the danger? ALL THREE TIMES?! What about the 4th?
Ah, that hasn’t happened yet. We have had two 10% market corrections this year – both intense in their relentless selling – but nothing like the Flash Crash of 1987 or panic selling from 2000 or 2008. ‘Luckily’ 2016 was but a -13% pause before pushing higher into a parabolic peak this January. But the patterns leading into 2000, 2008 and 2015 strongly suggest a 4th significant market drawdown event is forming.
But first, we likely bounce between ‘now’ (FOMC) and year end and potentially violently. But then I am projecting we pull down into that trendline support below the 100W EMA (white box and arrow) then bounce back into a 50/100W crossover before potentially and violently crashing lower in Q1 of the New Year.
Possible Crash Timing?
Remember the Ides of March: Bank Reserve Ratio Reports, FOMC Meeting, Trade Tariff Deadlines, Trump, Fed, China, BREXIT … point is, I will be watching the Macro, Fundamental, Intermarket and Technical background very closely to see how a trigger can justify my market timing call for a “Flash Crash” in Q1. just like I saw, alerted and traded with you in January and again in October of this year!!
Levels to Look For
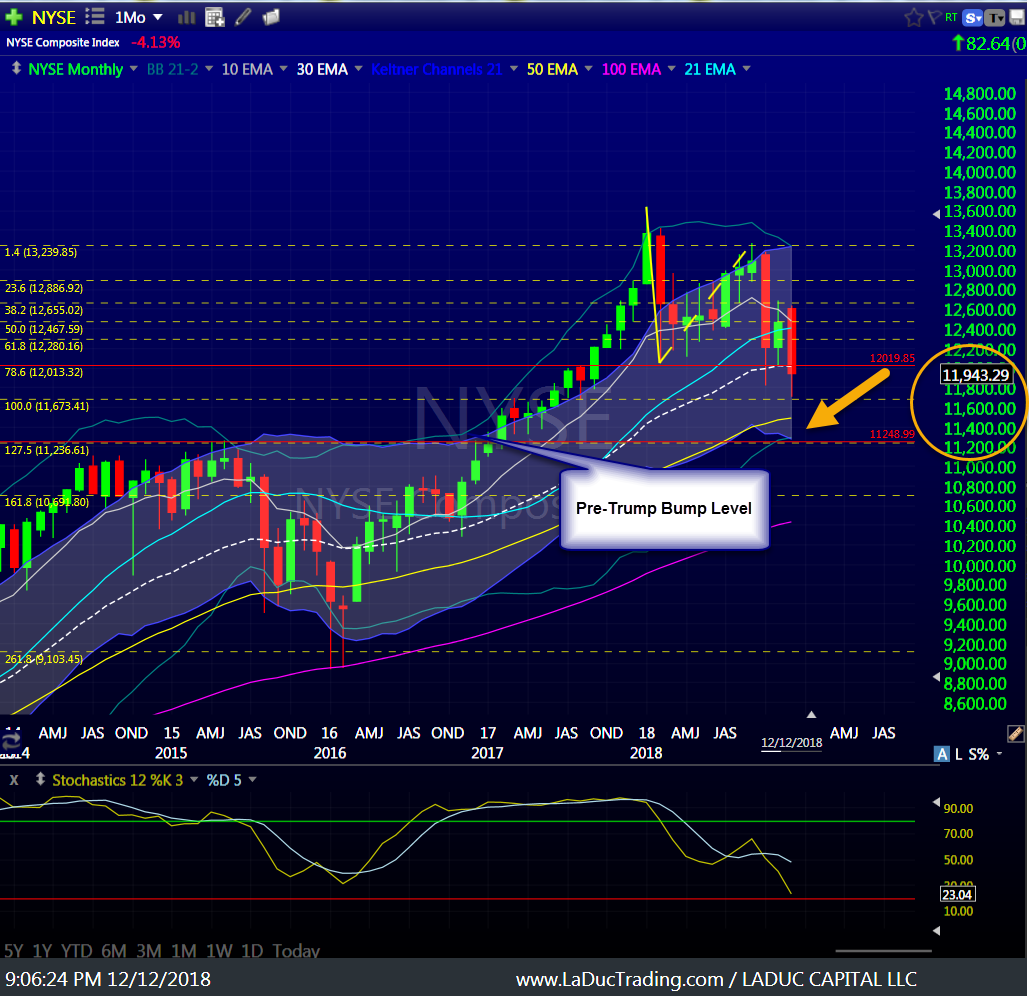
This is the NYSE Composite Index – on a Monthly timeframe. We are sitting on three levels of support: 78.6% fib retracement of the Jan to Oct move which lines up with Monthly support at ~12,000 and 30 Month moving average. I wouldn’t be surprised if we bounce back into the 12,400 area which is 10/21 Mo EMA crossover and 50% Fib resistance before revisiting lower levels (shown on chart) in Q1 leading into March. In short, I think this entire “Trump Bump” gets unwound in first half of 2019.
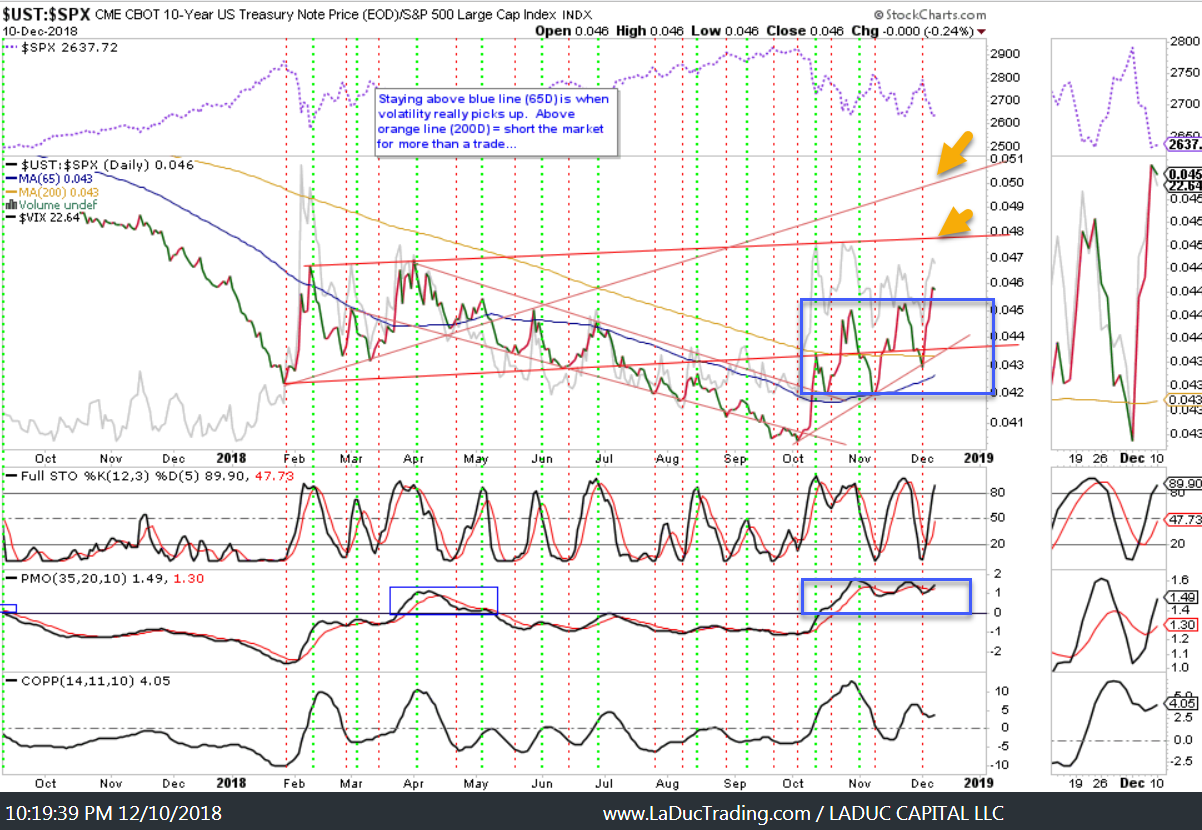
Bond Ratio Signals Credit Stress
Back in early 2104, this Bond/Corporate High Yield Ratio (HYG:IEF) signaled weakness but the market didn’t quite know why or how badly it would turn. It was the Oil slump when Crude cascaded down from $100+ in 2014 to ultimately $26 in Feb 2016. It was a nice tell for me. And with that: Credit always leads equities. We need to heed the warnings.
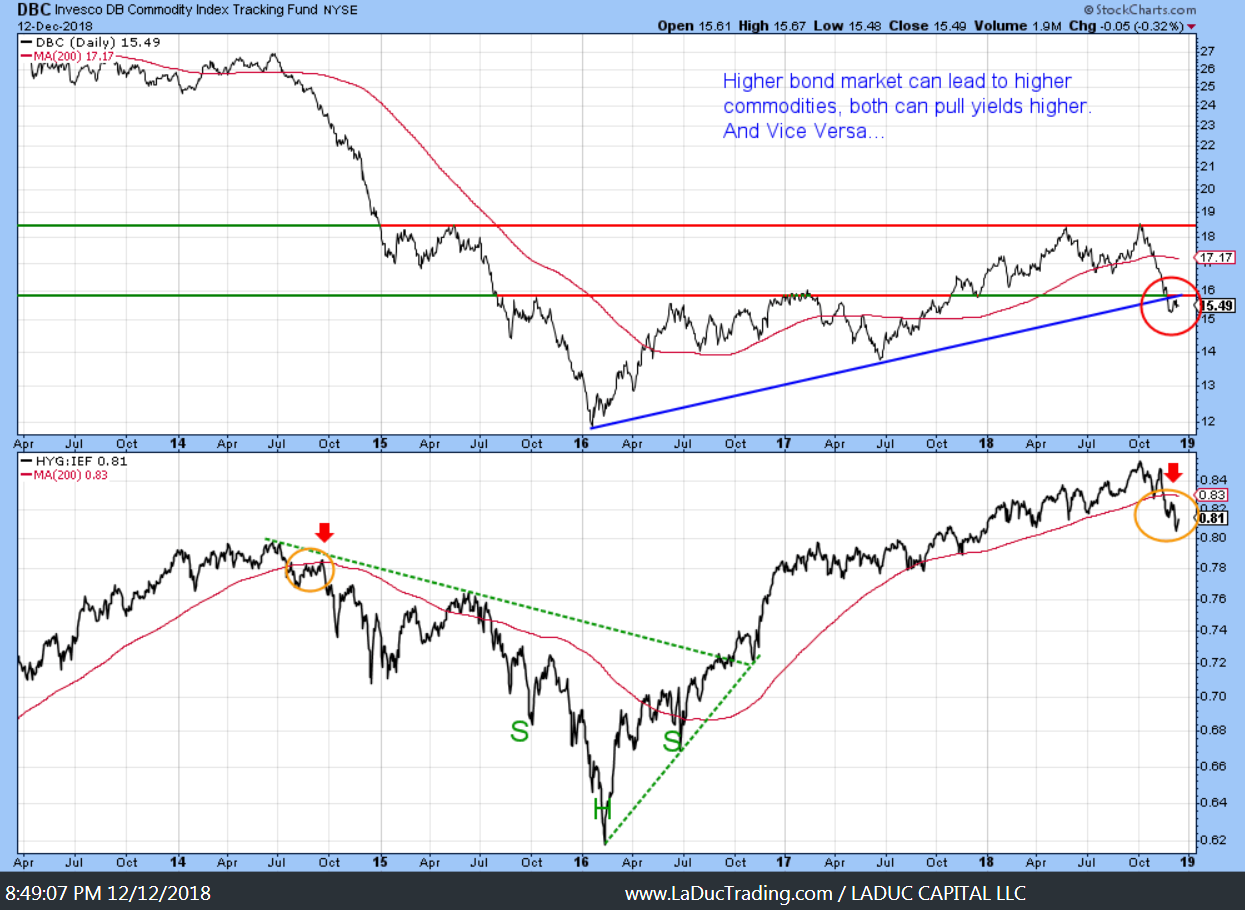
More Flash Warnings
Not since early 2014, with the Oil surplus being created by Saudi Arabia to hurt the nascent US Shale production companies, has this Bond/High Yield Corporate Bond ratio been so extended above it’s 13+30W EMA – or caused a crossover. But it is starting now.
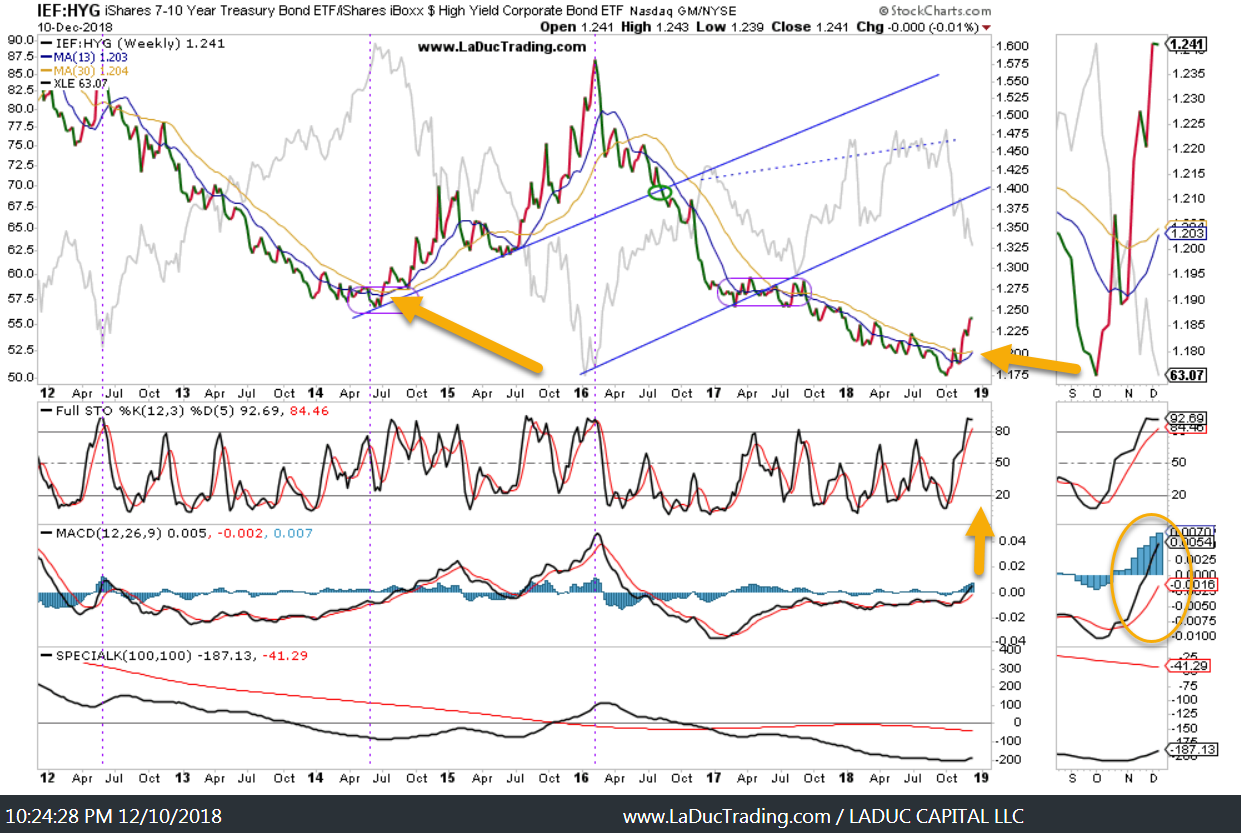
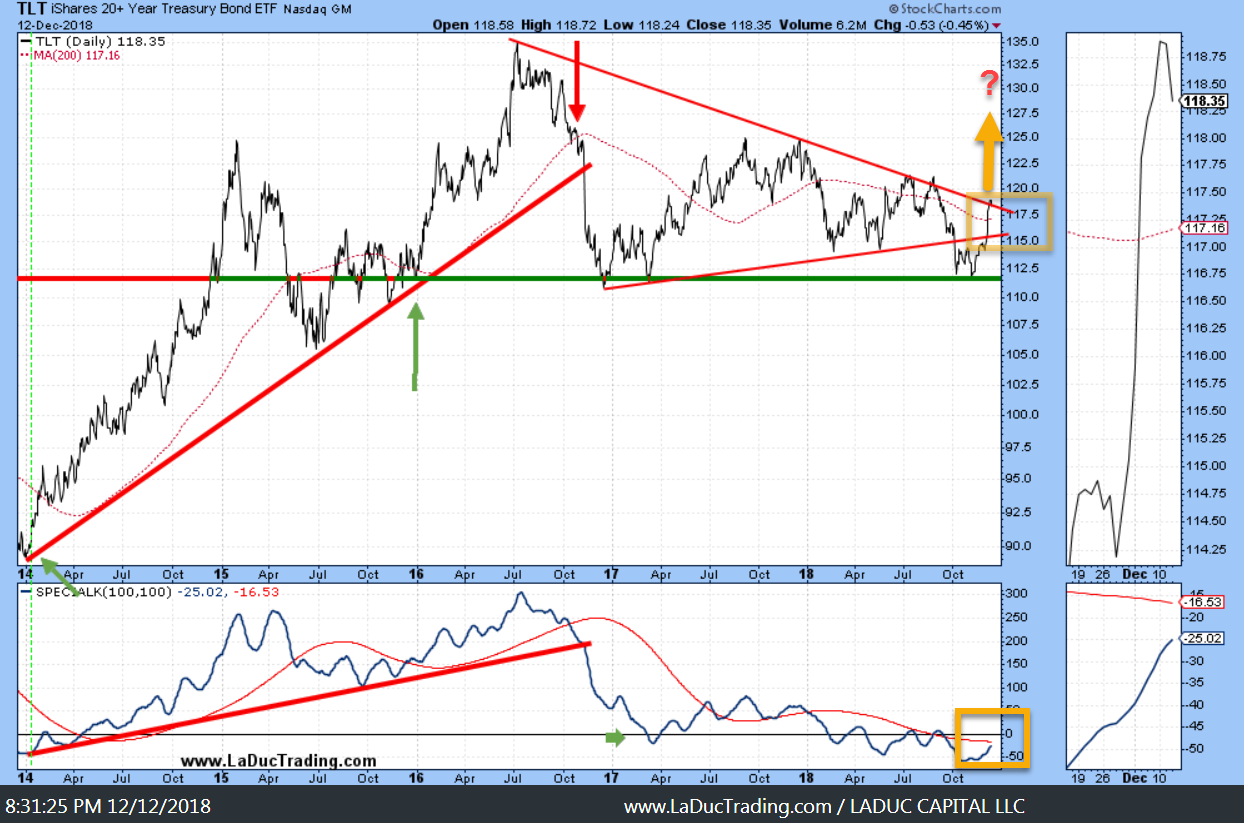
Bonds as Safety Play Again?
This year was an anomaly in which both stocks and bonds have sold off together. But in recent days, with this most recent market pullback, bonds have resumed their place as rotation into safety when equities get sold. With bonds firmer, perhaps ‘smart money’ is switching from equities to Treasuries for safety and/or making a bet the economy is indeed slowing, therefore, more Fed hikes are expected to come off the table in 2019. But until then, I think Interest Rates move higher into March, while bonds chop in the apex ($115-119), then bonds push above this wedge (with Gold) and move higher as USD and Rates fall.
Volatility is Still Going To Be A Thing
There is nothing in my Volatility read that tells me Volatility is done going up. It may be in fits and bursts, but I don’t see signs of my stock-bond-volatility ratio returning below the 65D EMA to assure me that market rally can follow through. I contend, Volatility is still being ‘suppressed’.
And why would volatility abate if the Fed is removing liquidity from the system? ECB joining as well now.

Thanks for reading and please consider joining me in the LIVE Trading Room where we work through Value and Momentum trade ideas and set ups every trading day.
At LaDucTrading, Samantha LaDuc leads the analysis, education and trading services. She analyzes price patterns and inter-market relationships across stocks, commodities, currencies and interest rates; develops macro investment themes to identify tactical trading opportunities; and employs strategic technical analysis to deliver high conviction stock, sector and market calls. Through LIVE portfolio-tracking, across multiple time-frames, we offer real-time Trade Alerts via SMS/email that frame the Thesis, Triggers, Time Frames, Trade Set-ups and Option Tactics. Samantha excels in chart pattern recognition, volatility insight with some big-picture macro perspective thrown in.
More Macro: @SamanthaLaDuc Macro-to-Micro: @LaDucTrading