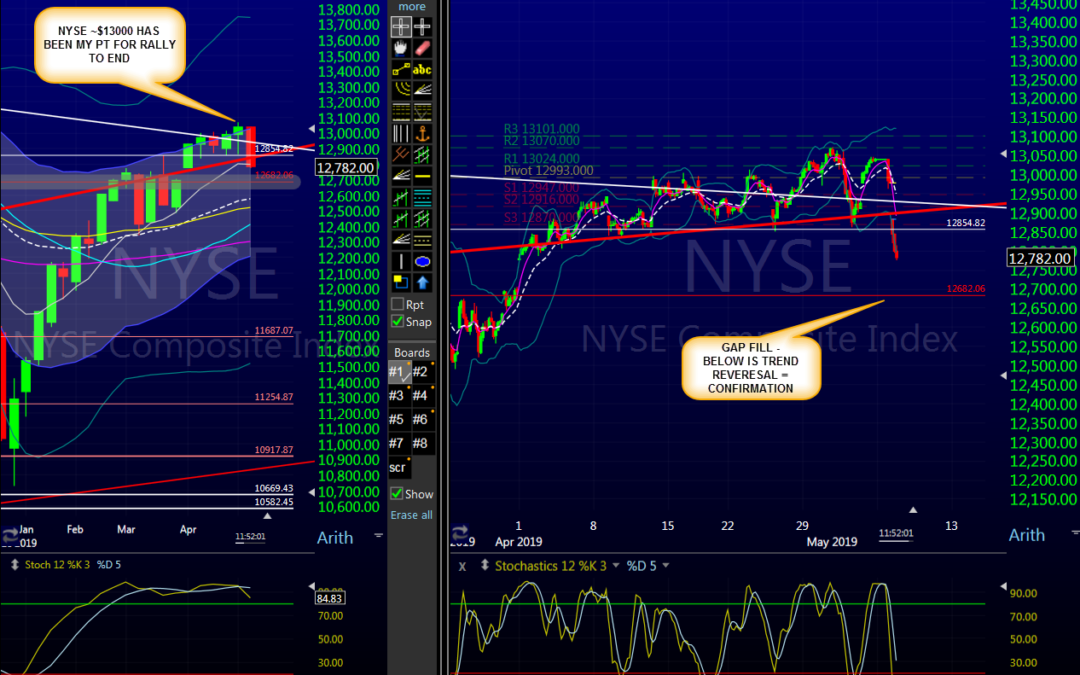
After being away on holiday the past week, I am leaving Spain – and loathe to do so. Fabulous and proper birthday vacation (see my Twitter feed for some pics if interested). I can see from afar that the market most decidedly broke down at the NYSE $13000 mark I’ve been predicting – since the December correction – while I was away of course.
For those who follow my Intermarket Analysis, the following are My Most Important Charts Right now – updated (from the plane). You can refer to past Client posts for the “before” but suffice it to say – I do not believe this correction is done.
I lay odds 60-40 to a crash-flash over sideways to lower. Either way I see lower – short and intermediate term.
Today/This Week: NYSE should have a wee bounce – into resistance – before a bigger break of its 200D.
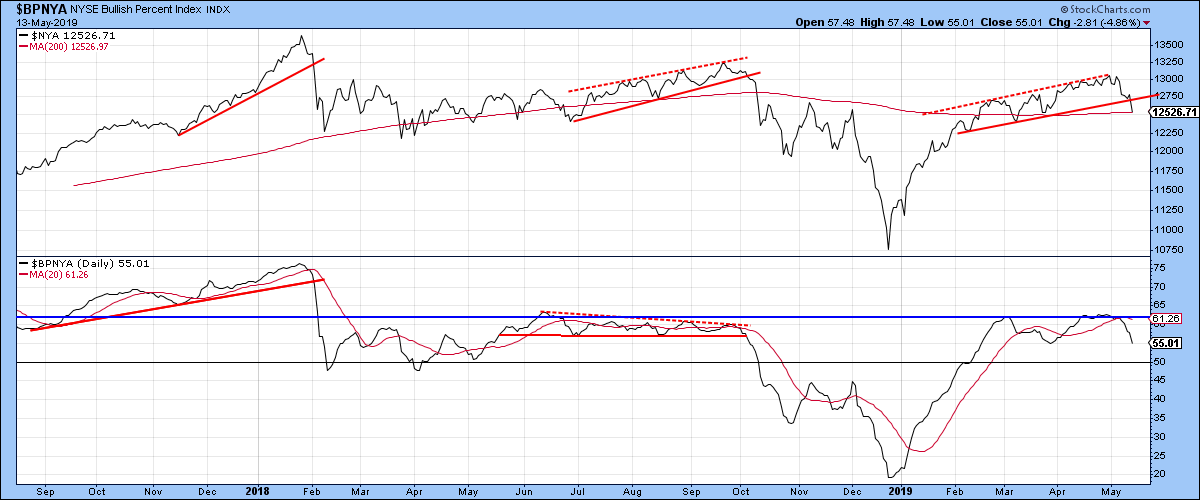
NYSE on its 50D and soon 100D, is short term bullish but a break opens it up to air pockets below.

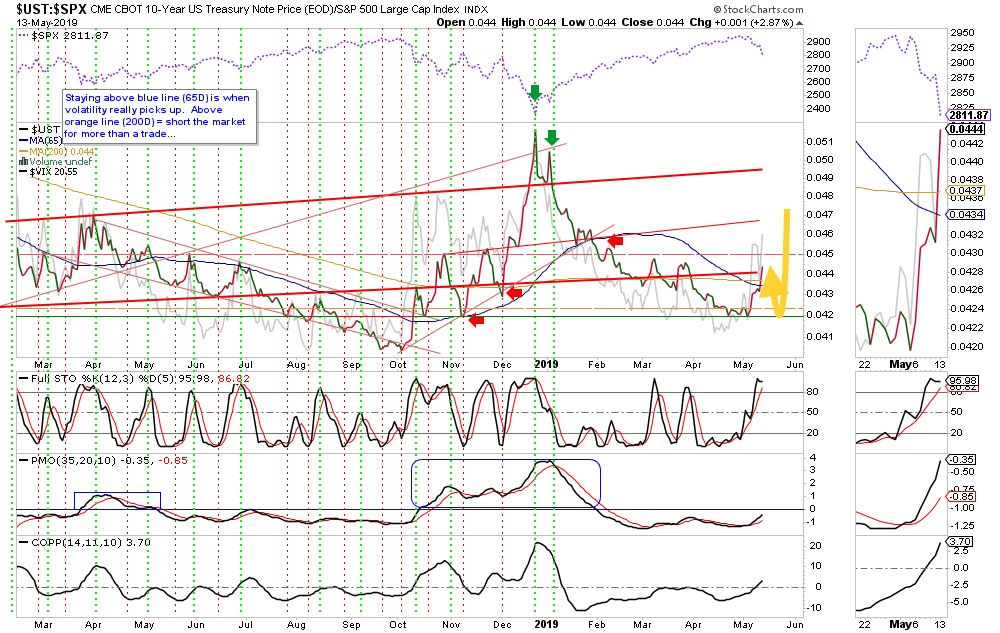
My Stock-Bond volatility ratio served as a great Tell. Now I wouldn’t be surprised with back and forth before busting higher – and with it market lower.
SPX breadth is weak still and can get weaker still.

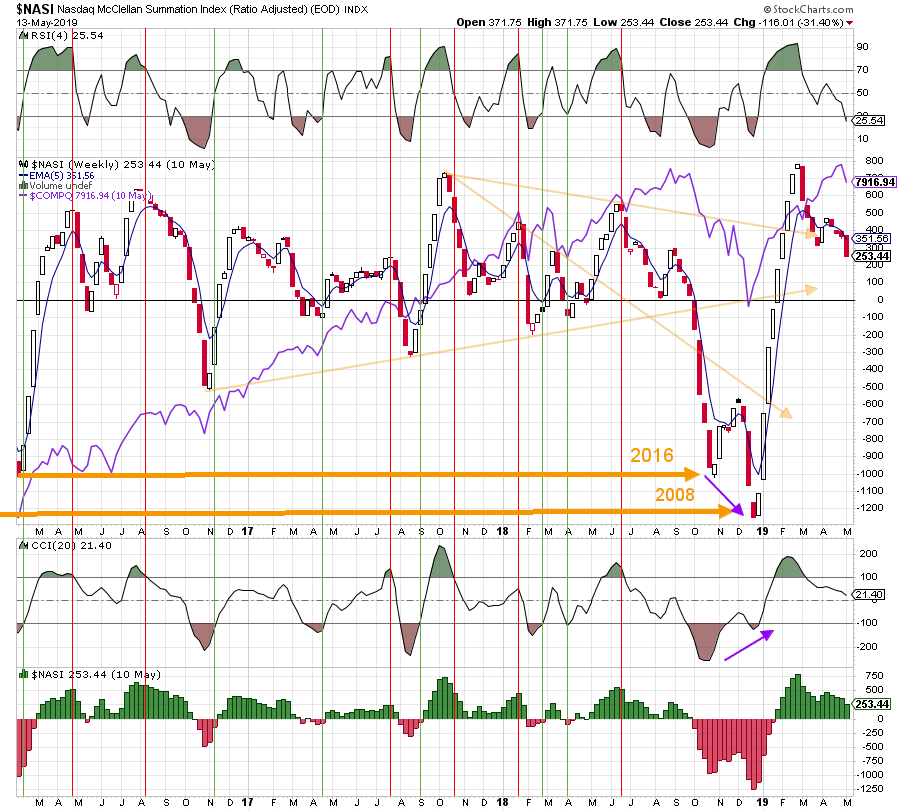
NASDAQ has a date with Zero Line and then we’ll see.
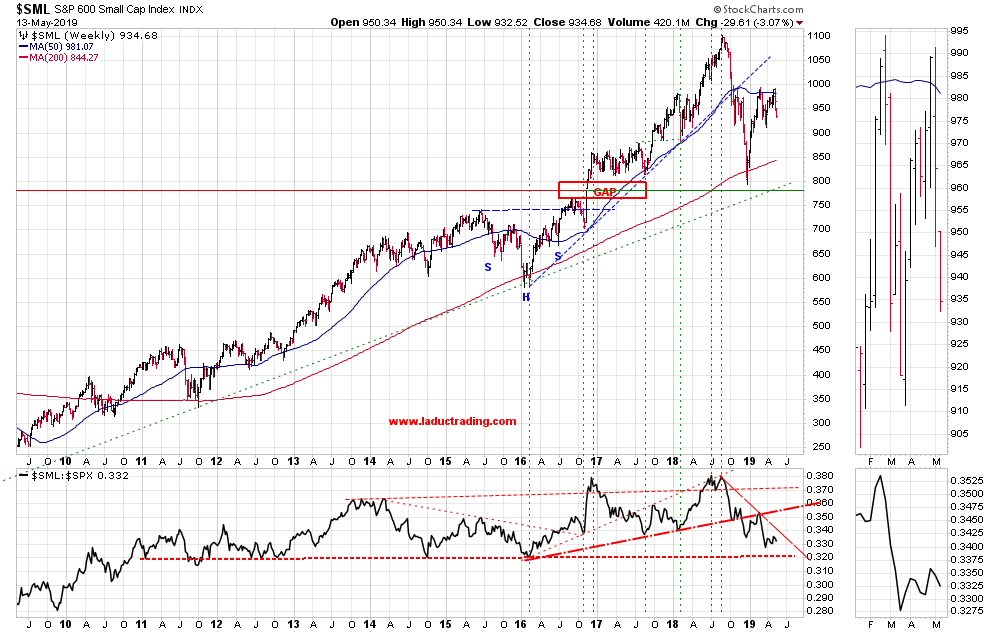
Small caps look done going down to you?
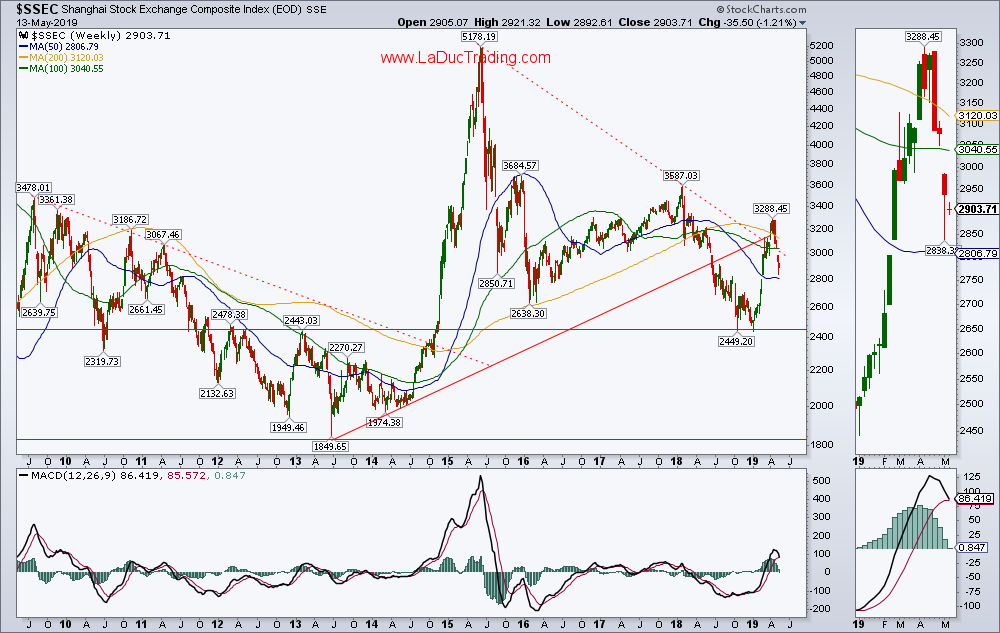
China look done going down to you?
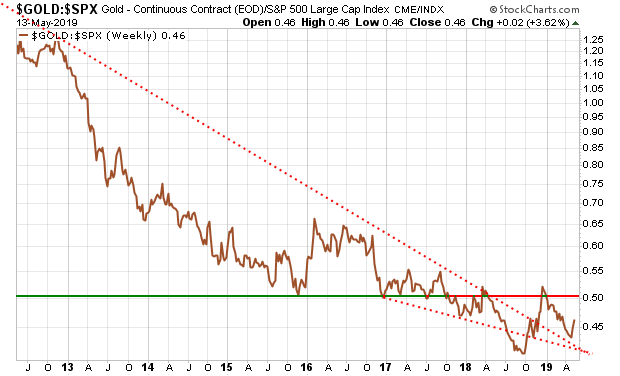
Gold is getting positioned. Not yet, but it’s an important Tell.
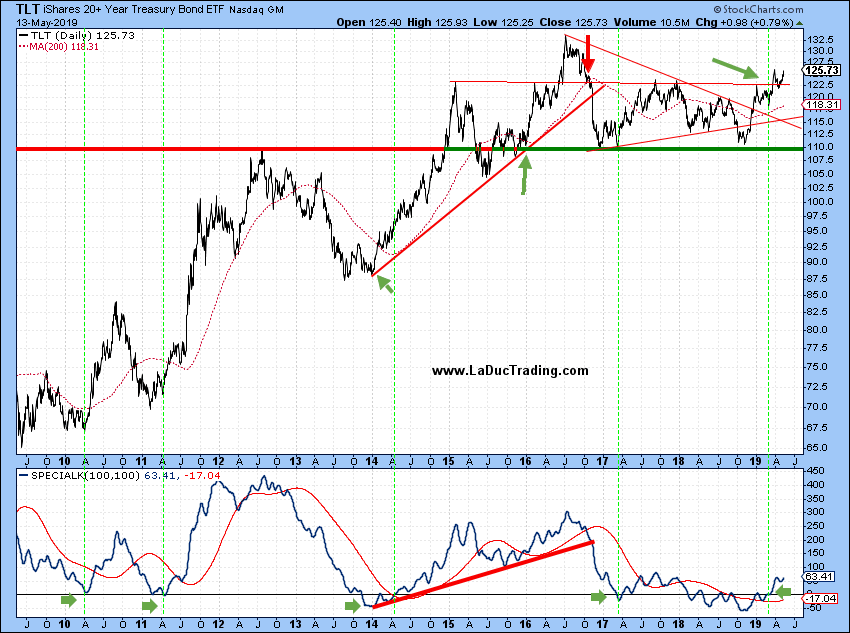
Bonds, whether poor auctions, structural over-supply, China threats of selling treasuries… this chart is intimating higher TLT.
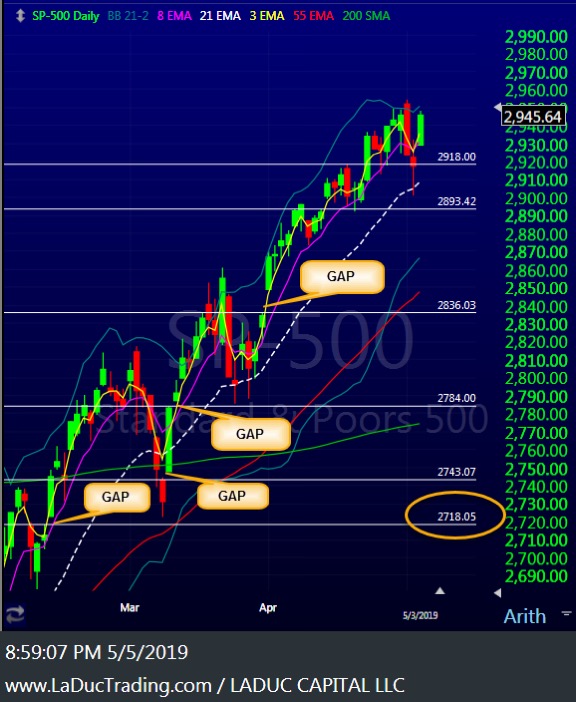
Remember this chart I gave you before vacation? How we doing?
And here’s a simple but effective roadmap for when we have a full-on Trend Reversal.
My connecting flight is delayed with no reported time announced. Assuming I reach US soil tonight my plan is to open my Live Trading Room tomorrow/Wednesday!
Hasta Pronto!
Samantha