Reflections and Inflections
Recently, stocks got hit while the VIX had its 2nd biggest rally ever, all the while bonds hardly budged. The risk off trade didn’t rotate into currency either. The US dollar has been moving lower while yields have moved up. FX traders must be paying more attention to fiscal rather than monetary policy.
Well I think that is about to change.
I recently spied a potential for a TED spread blow up in coming weeks. What’s a TED spread and why should you care? I’m borrowing from Wikipedia for the definition and my proprietary intermarket chart work for the analysis.
The TED spread is the difference between the interest rates on interbank loans and on short-term U.S. government debt (“T-bills”). (TED is an acronym formed from T-Bill and ED, the ticker symbol for the Eurodollar futures contract.) So why am I tracking a vehicle that graphically represents the difference between the three-month LIBOR and the three-month T-bill interest rates when my trading horizons are three months at best?! Because LIBOR has been spiking YUGE of late, and a rising TED spread often foretells a downturn in the U.S. stock market, as it indicates that liquidity is being withdrawn. The TED spread is an indicator of perceived credit risk in the general economy, since T-bills are considered risk-free while LIBOR reflects the credit risk of lending to commercial banks. An increase in the TED spread is a sign that lenders believe the risk of default on interbank loans (also known as counterparty risk) is increasing.
There is a fab teaser article my Lawrence McDonald on Why The LIBOR Spike Matters to Stocks and Profit Margin.
In recent years, ridiculously low rates placed interest coverage rations at a healthy 4.3x. But wait. What happens to that smelly $1T pile of BB in rated floating rate loans when libor spikes? In our view, interest coverage plunges below 3x on lower quality paper. If Powell’s FOMC goes through with (Street’s expectations) hikes 3-4x rate hikes this year, we’re looking at a substantial surge in the default cycle.
The surge in three-month libor matters because the entire ecosystem of U.S. short-term corporate finance is being repriced. The Street is finally waking up to credit risk tied to rising rates.
More Wiki-goodness: The long-term average of the TED spread has been 30 basis points with a maximum of 50 bps. During 2007, the subprime mortgage crisis ballooned the TED spread to a region of 150–200 bps. On September 17, 2008, the TED spread exceeded 300 bps, breaking the previous record set after the Black Monday crash of 1987. Some higher readings for the spread were due to inability to obtain accurate LIBOR rates in the absence of a liquid unsecured lending market. On October 10, 2008, the TED spread reached another new high of 457 basis points. In October 2013, due to worries regarding a potential default on US debt, the 1-month TED went negative for the first time since it started being tracked.
And now for my potentially revealing intermarket analysis that foretells great risk:
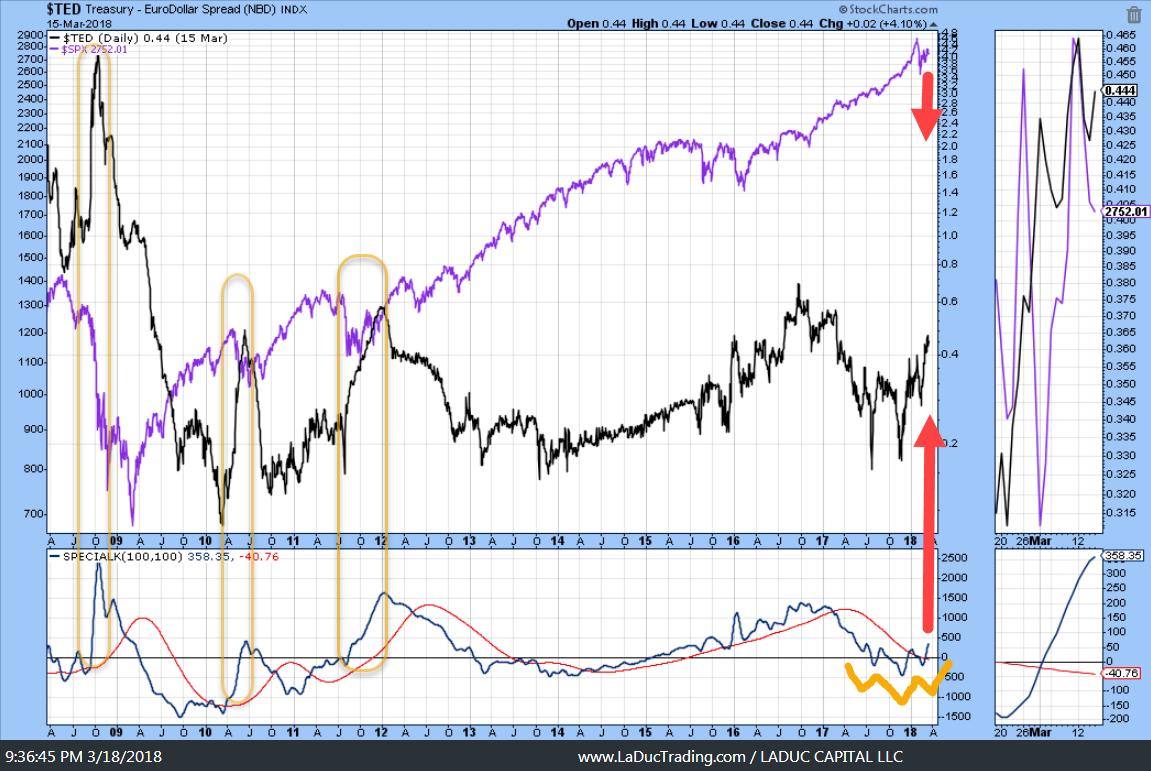
First, note the three yellow shaded areas on the left side of the chart and how these three TED spread blow ups corresponded with sharp stock sell-offs. Now scroll all the way to the right to see the inverse head & shoulder pattern forming in this indicator. Lastly, have a look at my 20-year bond chart TLT to see the similarities.
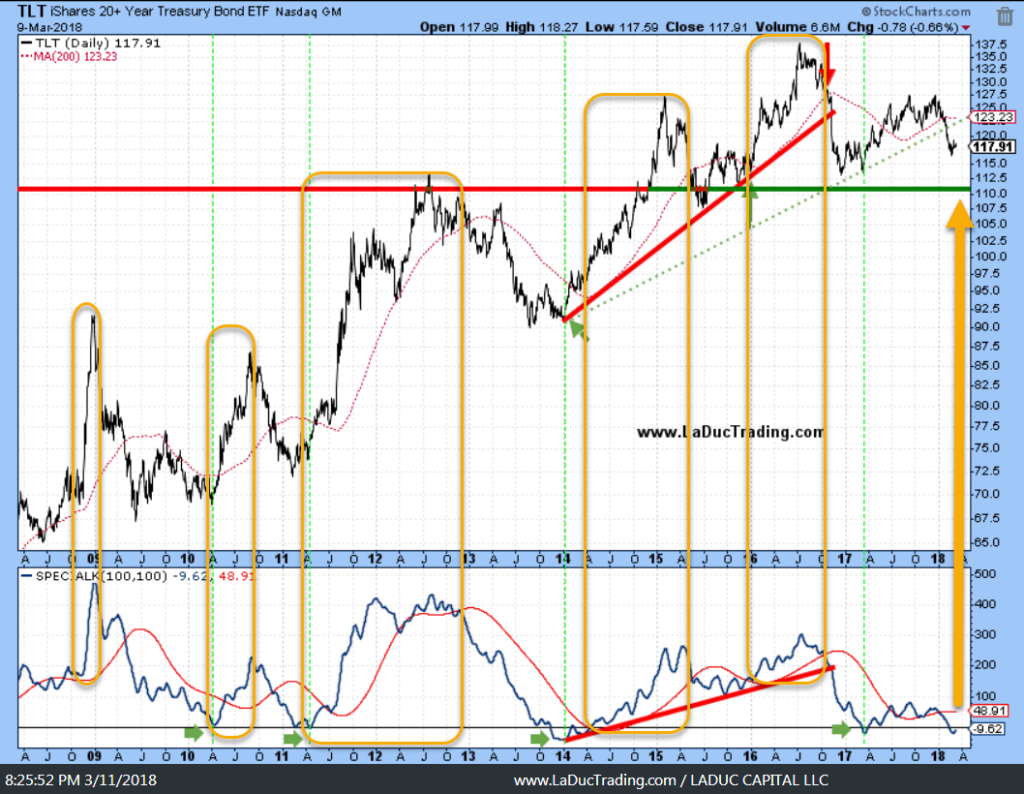
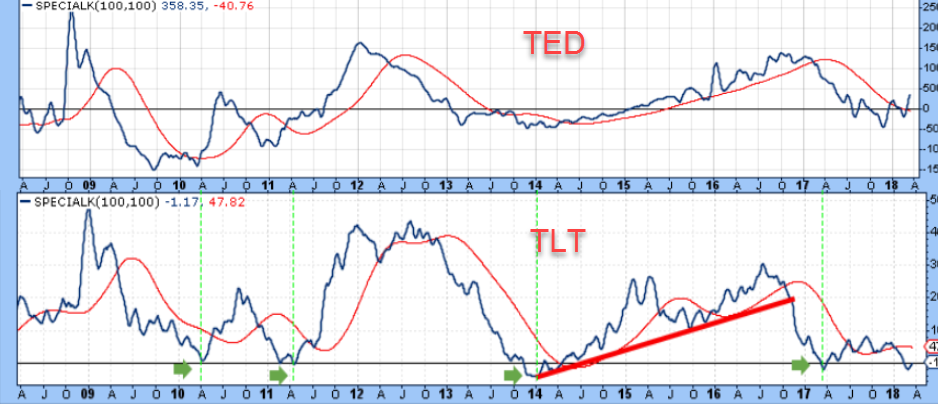
I never noticed before how similar these two instruments trade, once smoothed with a smoothing indicator and stacked on top of each other.
Now you know why I care. I think a rotation out of risky assets – think FANGMAN stocks – is coming and credit (TED spreads) will lead the next leg of the equities correction I have been predicting.
Libor is foretelling some serious fear in credit risk.
Chart: US LIBOR-OIS spread widens to the highest level since 2012 as tax-driven capital repatriation leaves a shortage of dollars outside of the US – pic.twitter.com/2dnBylxuY0
— (((The Daily Shot))) (@SoberLook) March 11, 2018
Speculators are so confident about higher rates that they are short almost $4 trillion ED futures.
specs are net short $4 trillion of eurodollar futures https://t.co/8v9WIaFpHo pic.twitter.com/Xc3o0Vvg8t
— Adam Collins (@eversightwealth) March 15, 2018
Kevin Muir has a good take in his article That’s Not a Bond Bear Market:
Much of Europe is still experimenting with negative rates, Japan’s massive QE and pegging of the 10-year rate ensures their shadow level of interest is still firmly below zero, and to top it off, until recently, inflation has been relatively muted throughout the globe. So it’s no wonder the Fed has not rushed to get out ahead of the curve and raise rates aggressively. Up until a few months ago, overly easy financial conditions were about the only reason to raise rates.
That’s why last week in my Intermarket Chart Attack, I proposed TLT and USD would likely bounce even though Trump Tariffs are USD deflationary. My thesis: what if the Fed is slow to raise rates and they fall on this expectation? I wonder if all that hedging of higher rates starts to get unwound after the Fed announcement causing TED spreads to spike and markets to sell off. We’ll know soon enough
More Trade Ideas
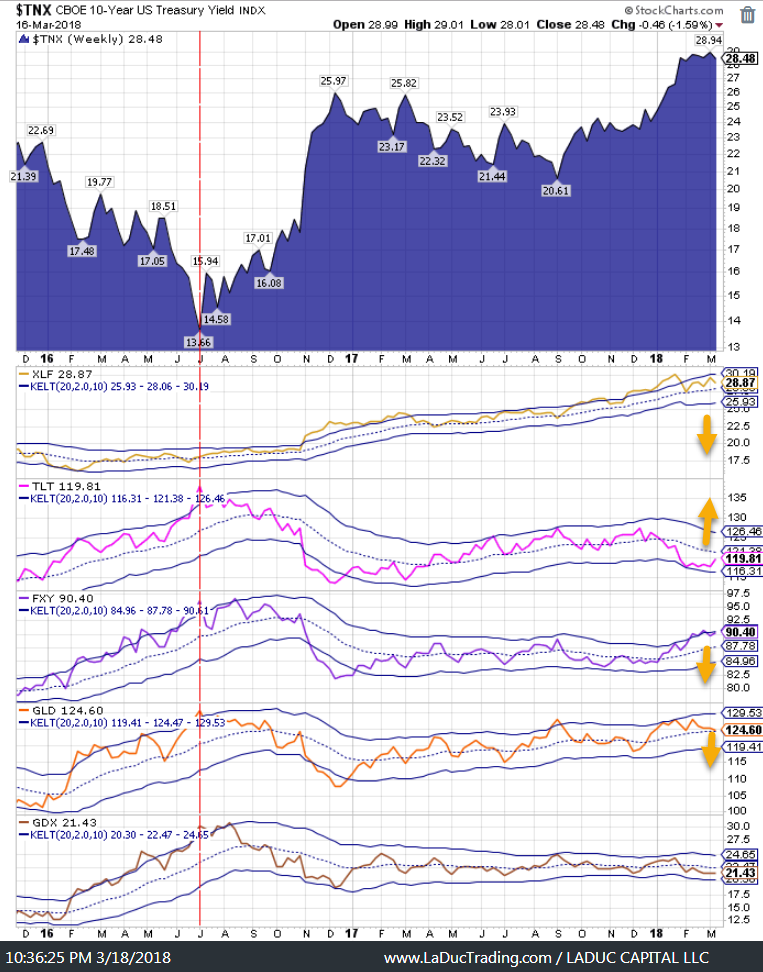
TIP/TLT ratio breaking out foretells an inflation bet with commodities. The opposite is also true.
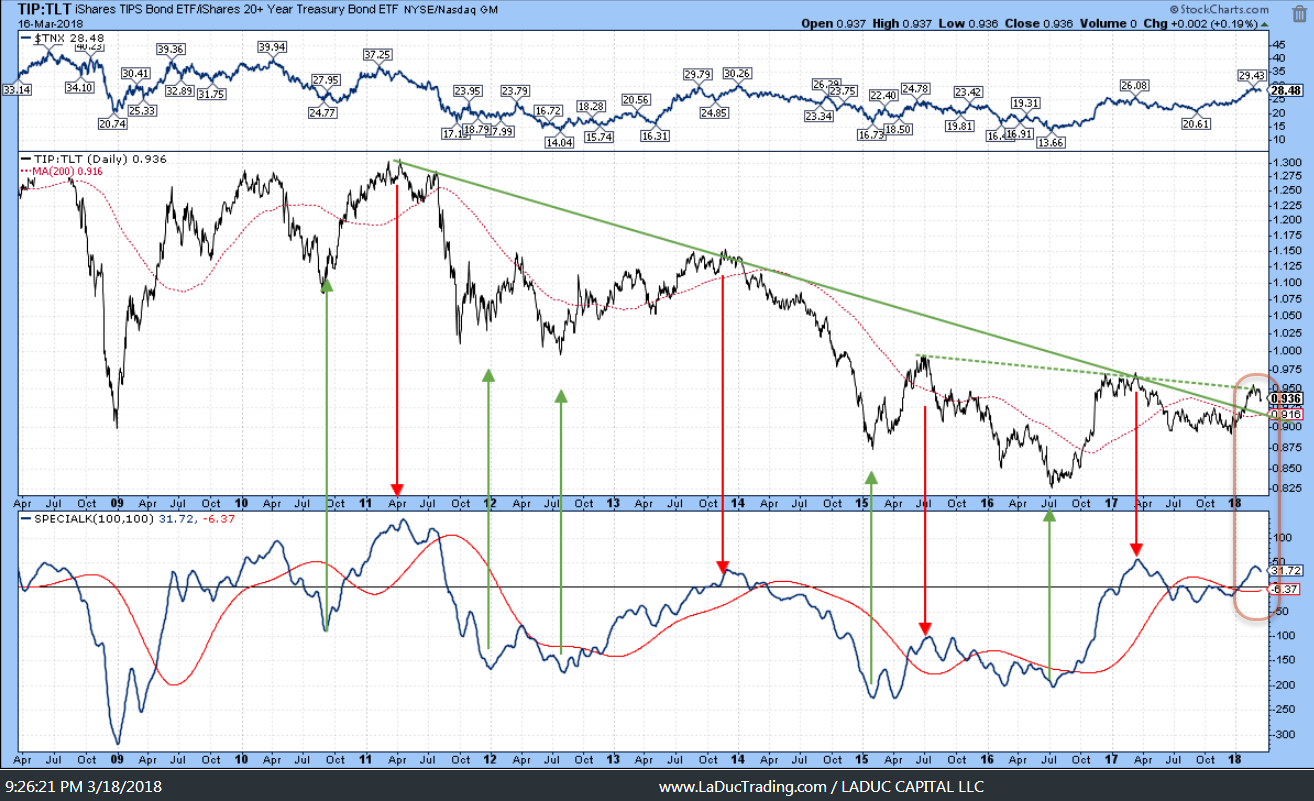
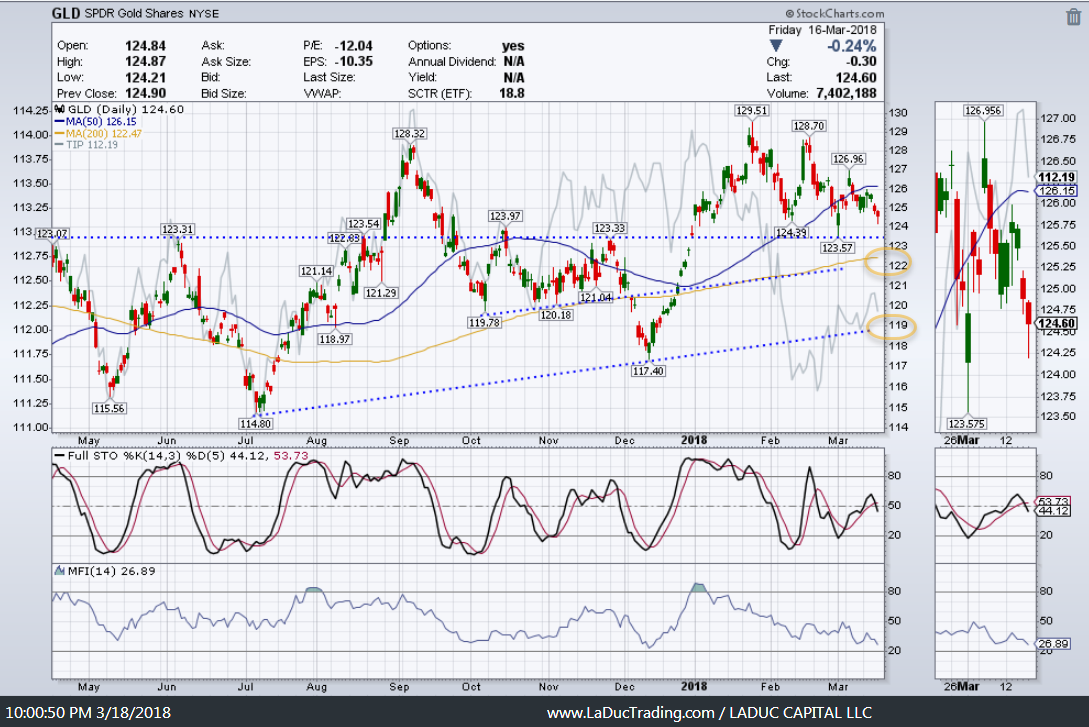
With that, TIP and GLD look lower.
And financials look lower too.
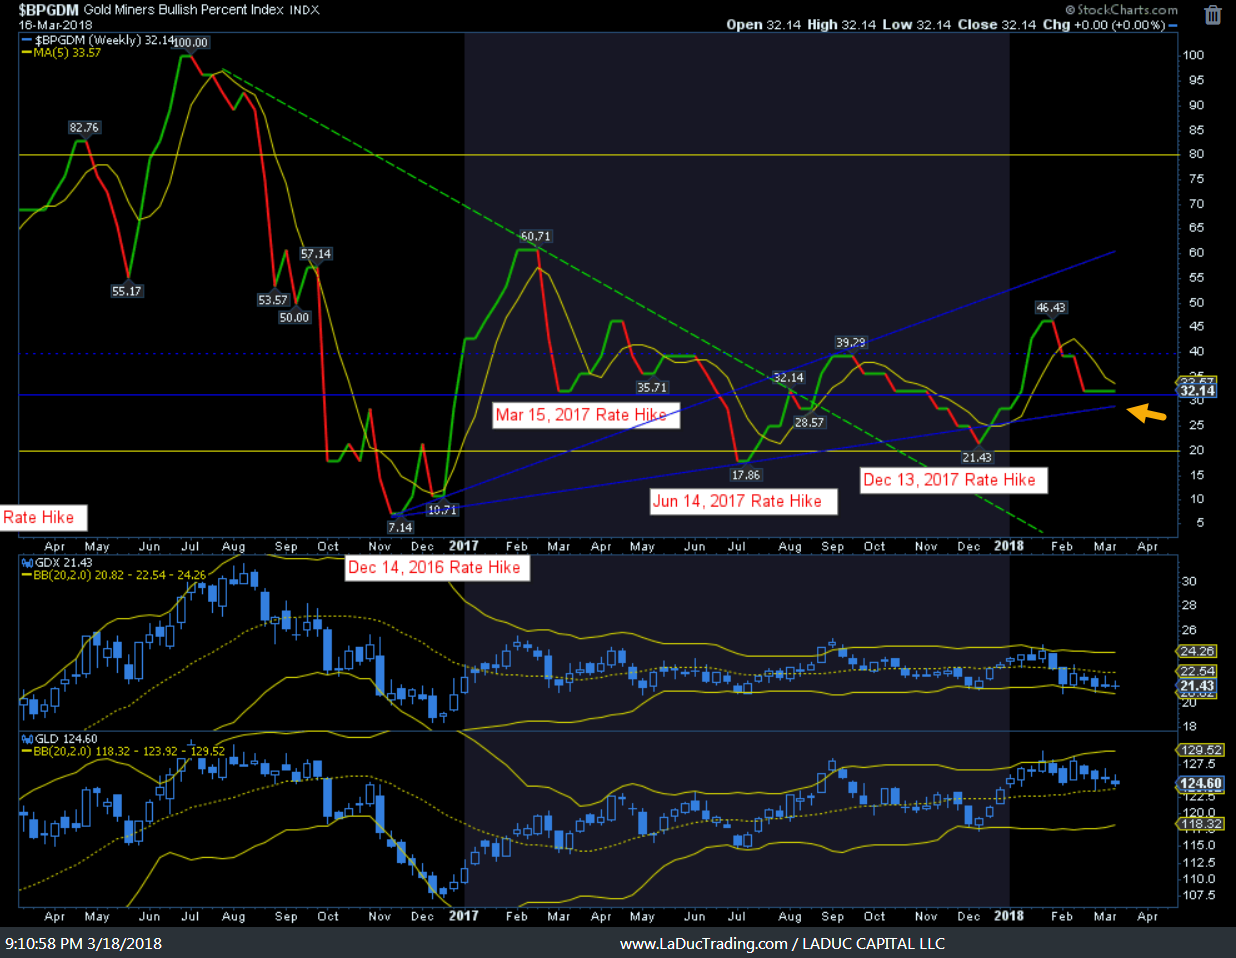
And for the first time since the last five anticipated Fed rate hikes, I am short, not long Gold, into Wednesday’s meeting.
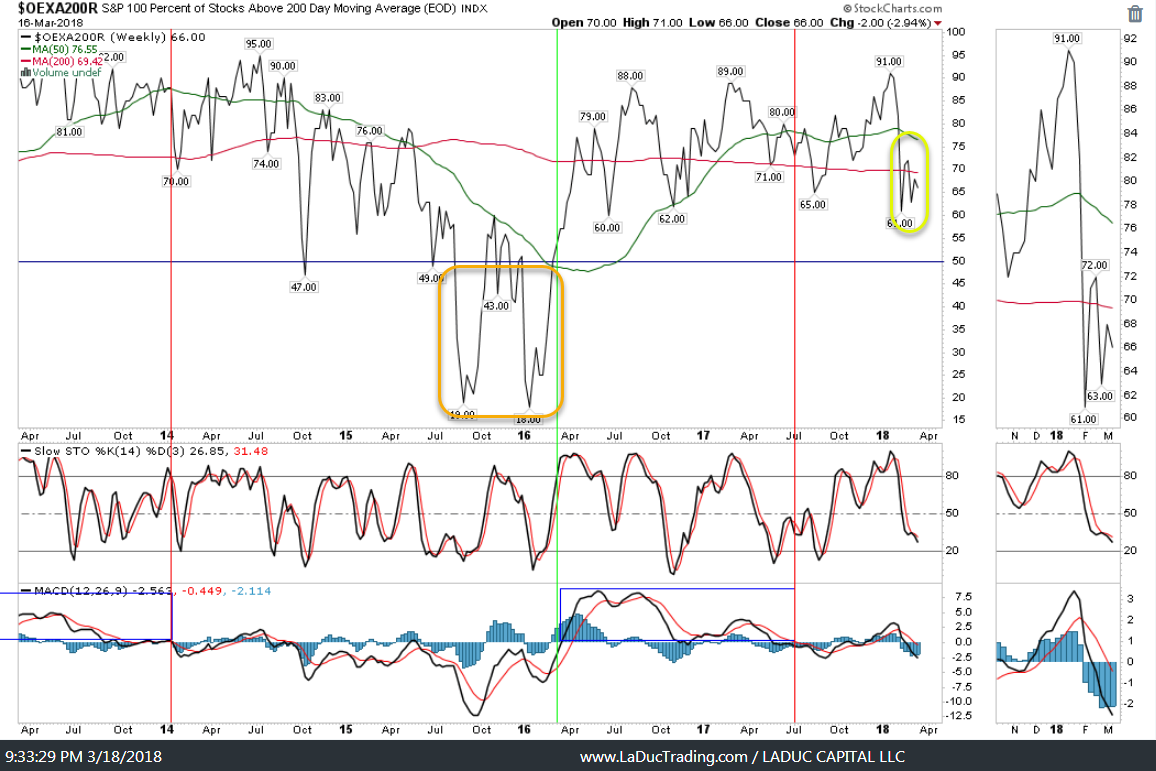
And as long as the top 100 S&P companies are languishing below their 200D, the breadth is still projecting weakness – we just don’t see it yet in the indices.
Upcoming Events
Seeking Alpha’s latest Stocks to Watch article for a preview of next week’s busy calendar of events.
Expected Move
Last week market makers priced in a ~$40 SPX expected move and this week $45. It’s a Fed rate decision week after all!
Economic Releases
Monday – Brexit talks in Brussels. G20 Meeting in Argentina.
Tuesday – UK CPI
Wednesday – Fed rate decision: 25bp to 1.75% is expected at 95% with most watching for clues of the future rate hikes. UK earnings may show failure of wage growth which tempers the perception of rate increases.
Thursday – UK Retail Sales and BoE UK rate decision.
Friday – EU summit/Brexit guidance. Canadian CPI and Retail Sales MoM. END OF TRUMP’S TARIFF WAITING PERIOD.
Earnings Releases
#earnings for the week $MU $ORCL $FDX $NKE $PLCE $CSIQ $FIVE $HQY $DRI $WGO $DLTH $GIS $ACN $KBH $CHFS $EGO $SGH $SCON $MDWD $FCSC $MIK $JKS $GES $CAG $CCL $HTGM $LEJU $CTAS $HOME $CWCO $NOMD $ATTO $WPM $TGEN $AVGR $FSNN $CMC $OTIV $MLHR $JAG $CDORhttps://t.co/lObOE0dgsr pic.twitter.com/DH7ckSU96N
— Earnings Whispers (@eWhispers) March 17, 2018
upcoming #earnings releases with the highest #volatility $HOME $SCS $LAUR $GES $MIK $CATO $DLTH $GIII $ARCO $MLHR $SGH $HQY $LE $FIVE $MU $AIR $JKS $CSIQ https://t.co/lObOE0dgsr pic.twitter.com/SKPNWAqnxr
— Earnings Whispers (@eWhispers) March 18, 2018
Macro Take – Oil
Taken from John Kemp – Reuters News: Oil market shrugs off rising threat to Iran deal.
President Donald Trump’s decision to replace his secretary of state with a more hawkish figure should have been bullish for oil prices since it increases the probability the nuclear deal with Iran will be abandoned in May.
Failure to recertify the deal could lead to the re-imposition of secondary sanctions and pressure from the United States on other countries to reduce their purchases of Iranian crude again.
But the decision to replace the secretary of state barely registered on the spot price of Brent crude and the six-month calendar spread continued to soften, suggesting that traders see little impact for the moment.
In theory, failure to recertify could remove hundreds of thousands of barrels of crude from the market and cause a significant tightening of the supply-demand balance.
MACRO RISK
Corporate tax cuts approved by the U.S. Congress and the president at the end of 2017 have been broadly welcomed by investors and the business community.
Tax reductions for businesses and many individual taxpayers should increase the economy’s productive potential as well as stimulating short-term consumption and investment.
Overall, the tax reductions should have a positive impact on economic growth and oil consumption in the short term, which should be bullish for oil prices.
But the medium term impact is more uncertain because tax reductions are boosting the economy at a time when the business cycle already appears relatively mature.
The fiscal stimulus may be accelerating the final stages of the economic cycle and bringing forward the date of the next recession.
The current expansion is already the third-longest on record and it will become the second-longest in May 2018
For the time being, however, the Trump administration’s increasingly hawkish position on Iran has not been enough to offset the impact of increasing supply from shale.
Happy Trading and don’t forget to hedge.
Samantha
At LaDucTrading, I analyze price patterns and intermarket relationships across stocks, commodities, currencies and interest rates. I develop macro investment themes to identify tactical trading opportunities and employ strategic technical analysis to deliver high conviction stock, sector and market calls. Through LIVE portfolio-tracking, across multiple time-frames, my real-time Trade Alerts via SMS/email frame my Thesis, Triggers, Time Frames, Trade Set-ups and Option Tactics. I selectively use Unusual Option Activity (UOA) and Deal Flow but no proprietary indicators – just solid chart pattern recognition, volatility insight and some big-picture perspective thrown in. Twitter: @SamanthaLaDuc