This is an Intermarket Analysis chart review which graphically represent relationships (strong and weak) that can foretell how the undercurrents are moving to better identify where stocks/sectors/indices are flowing! You can see (and should see!) my last Intermarket Chart Attack here.
The Suspense
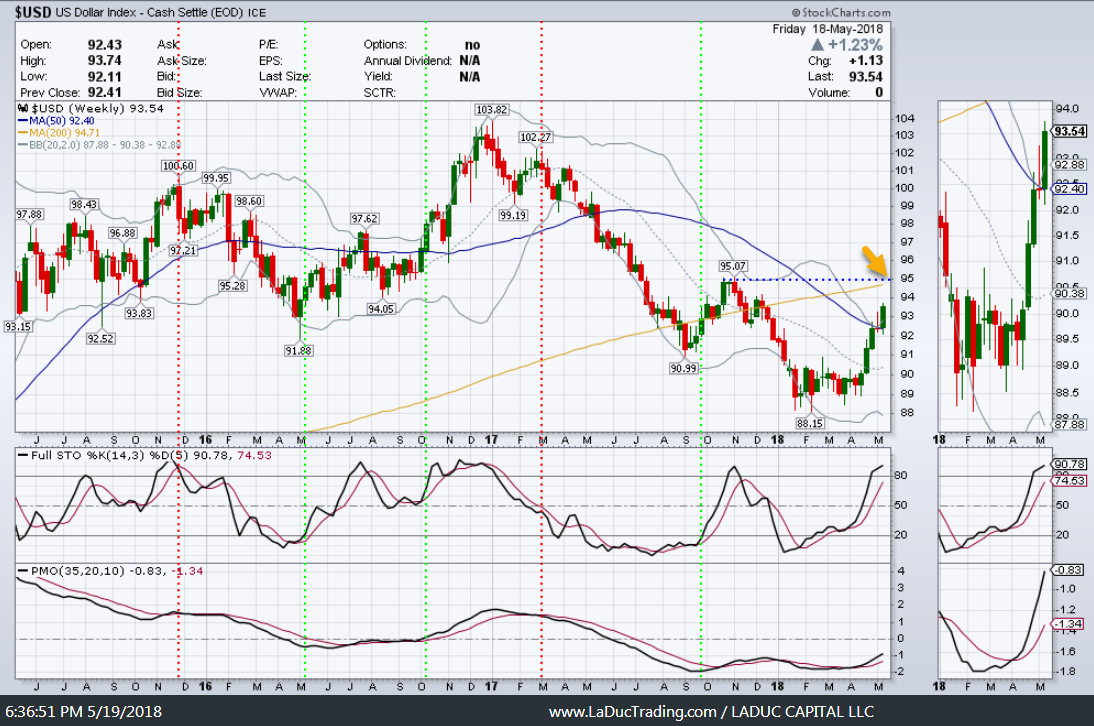
I have been calling for (and trading) a USD bounce since March and I think we have two more weeks to go before it’s ‘done’ this upleg. My price target is that 200D around $95. Having said that, the US Dollar can easily pull back on inflation prints or China trade talk this week, but by May 31st, when the Fed lets $29 billion worth of bonds mature, I suspect the EUR gets sold, causing the USD to run higher into resistance. At that point, I can see some correlated plays in Gold, Miners, Bonds worth playing.
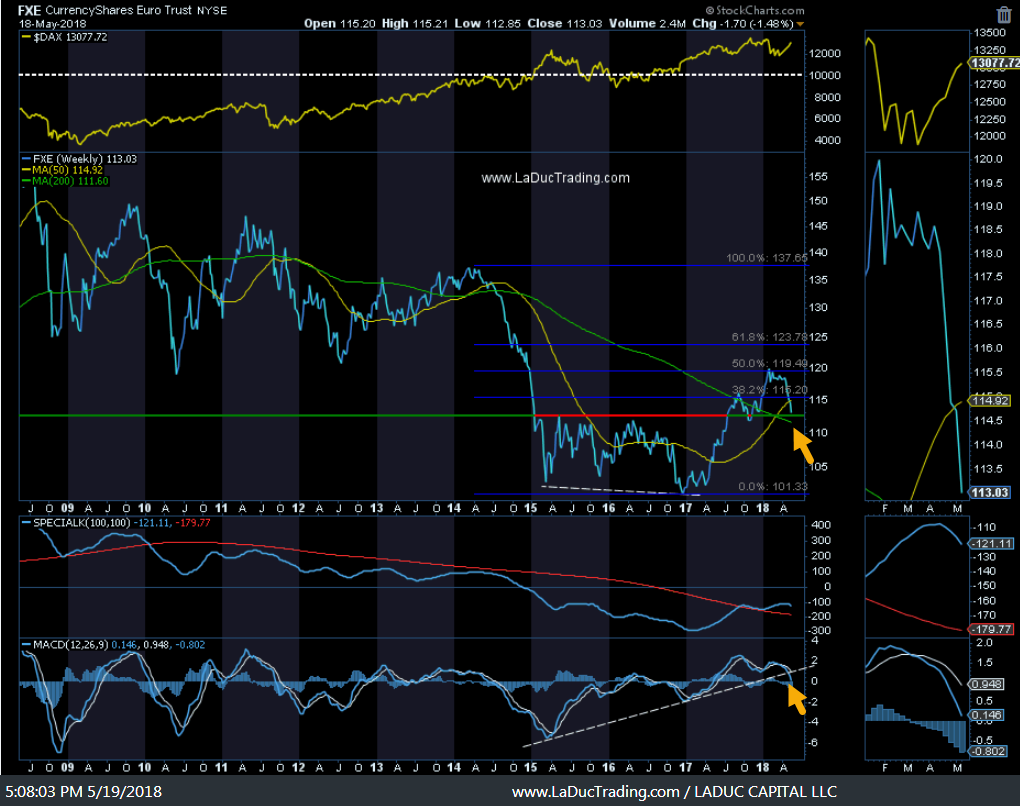
Speak of the devil, wouldn’t you know, the USD resistance target above would time nicely with a EUR pullback – which is $111.60 around the 200D for FXE.
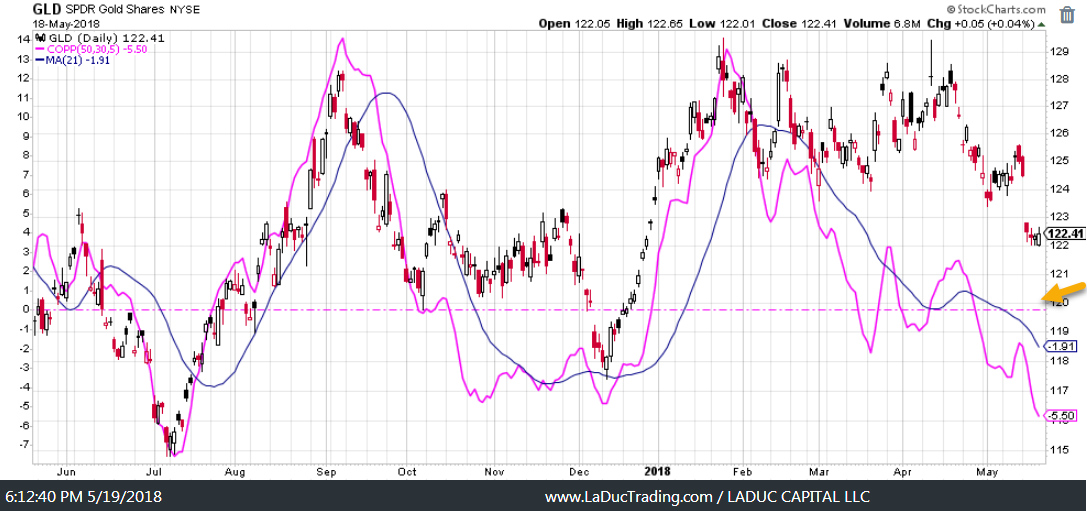
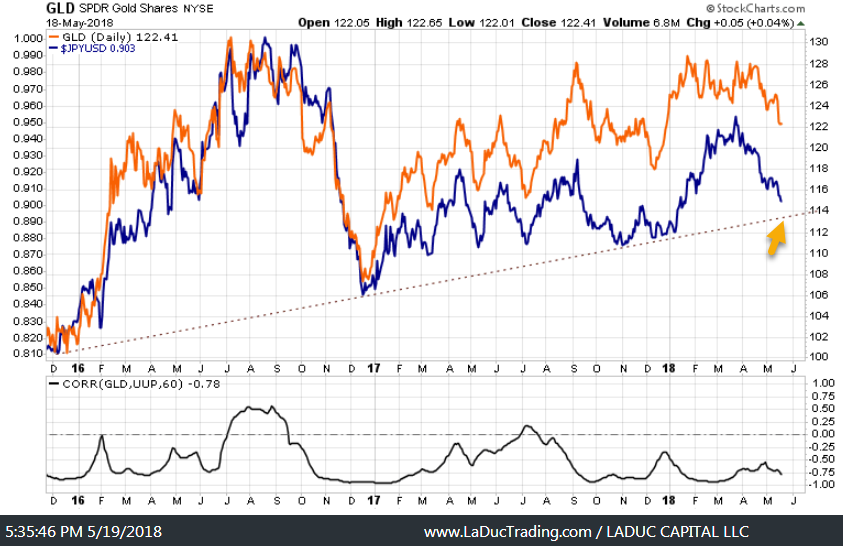
My recent post, Fishing Idea: Reflections on Gold, Yen and US Dollar, is a major trading theme for many so I will update below with multiple charts for perspective. Since Gold bugs are starting to come out of the woodwork en masse, I think it is helpful to show the levels – $120 channel support – where I suspect Gold needs to hold and reverse for them to be right.
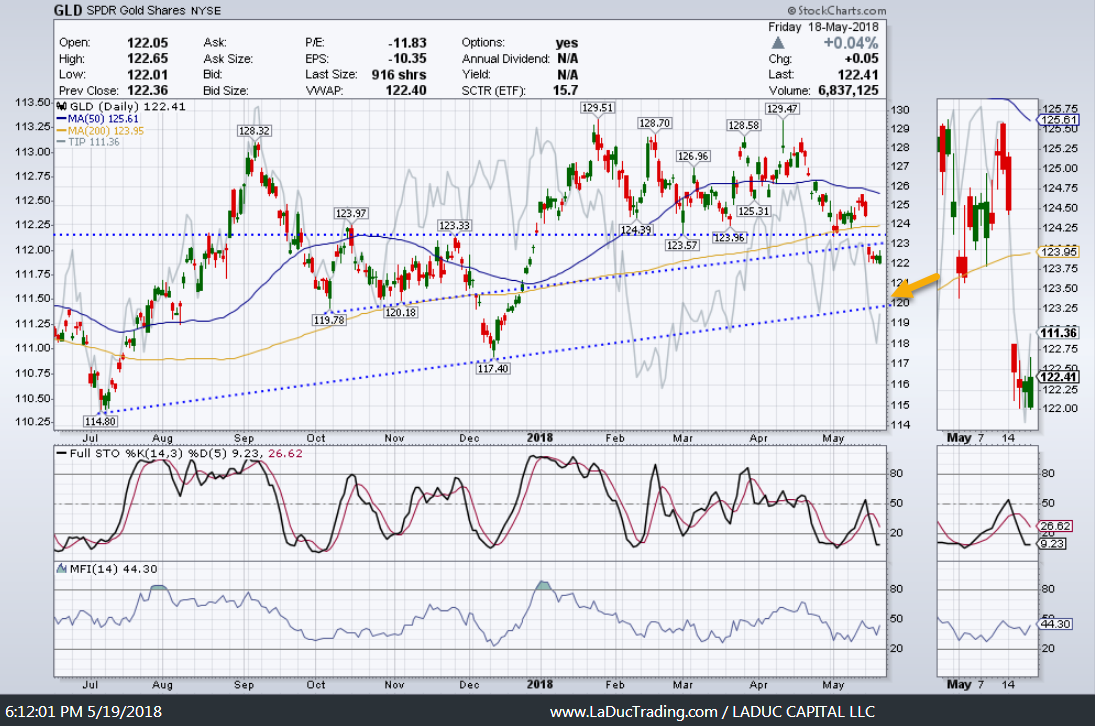
In fact, $120 has been a strong magnet and point of reversal for GLD for some time.
When compared to the Dollar-Yen carry trade (plotted inversely below), the USD/JPY has a bit further to rise before a turn. This USD/JPY ‘channel check’ times well with the USD and EUR and GLD trend-line supports, which is oh-so confidence-building.
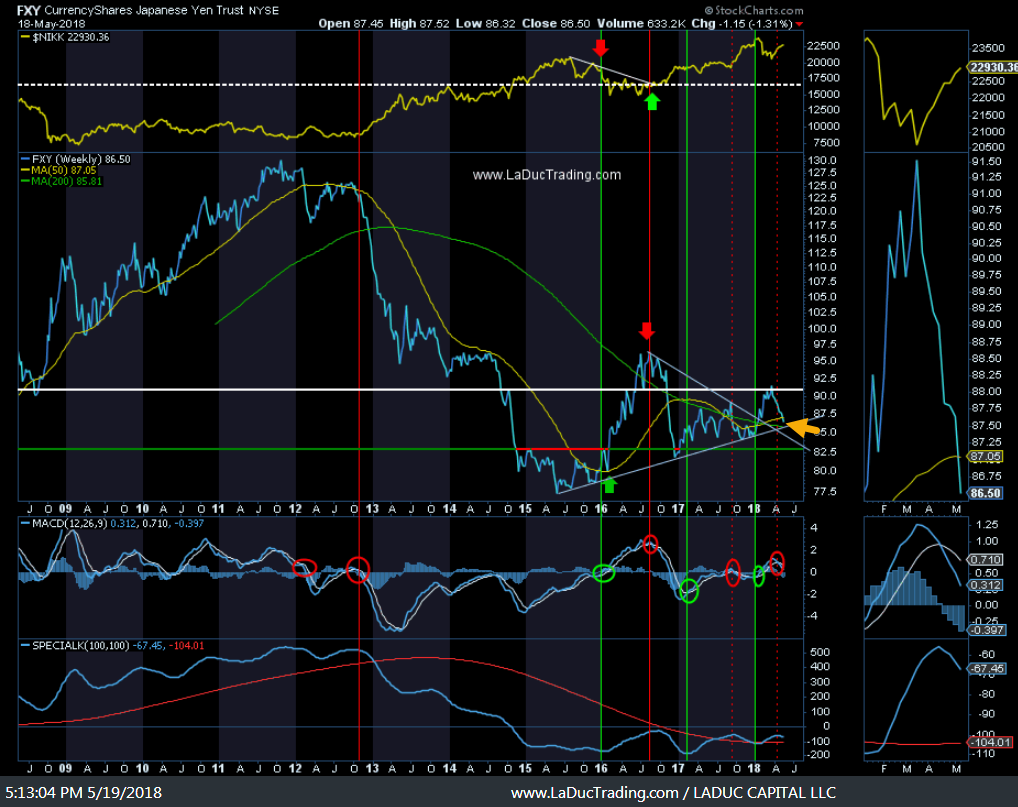
A retest of the FXY (Yen ETF) back to the apex of the triangle, from which it broke out, could result in a strong reversal – again at the 200D ~%85.80. This could be seen as a meaningful inflection point: continuation lower would delight Abe (BOJ). A reversal at the 200D could set up a run through/up/above the white line of resistance. Basically, any price above that thick white line ~$92 is bullish Yen and anything below $86 is bearish Yen.
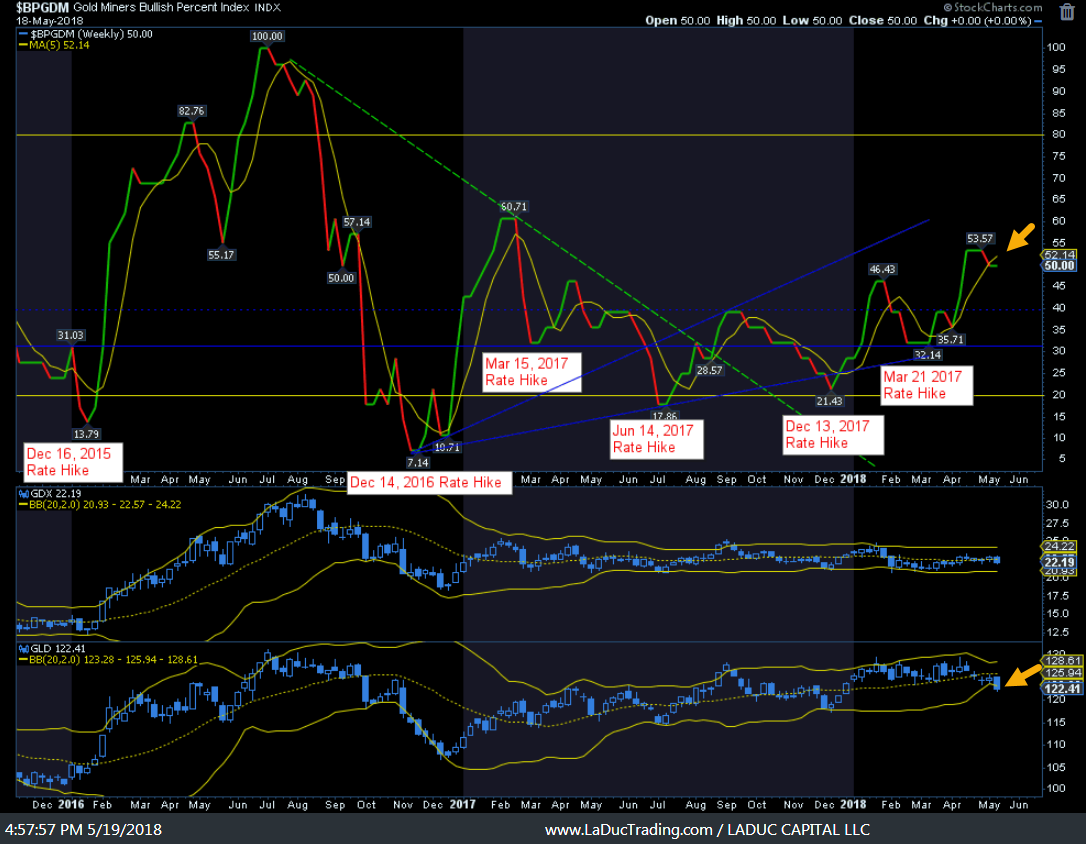
Gold, and to a lesser degree Silver and Miners, have been pulling down into the next Fed meeting in June, as 10-year yields have broken out above 3% the past month. The resilience in the gold miners bullish percent index in spite of the US Dollar rally speaks to a divergence of strength under the surface. The trigger could be the next Fed rate hike or something unexpected but I see a move of substance coming for gold, silver, platinum and miners this summer.
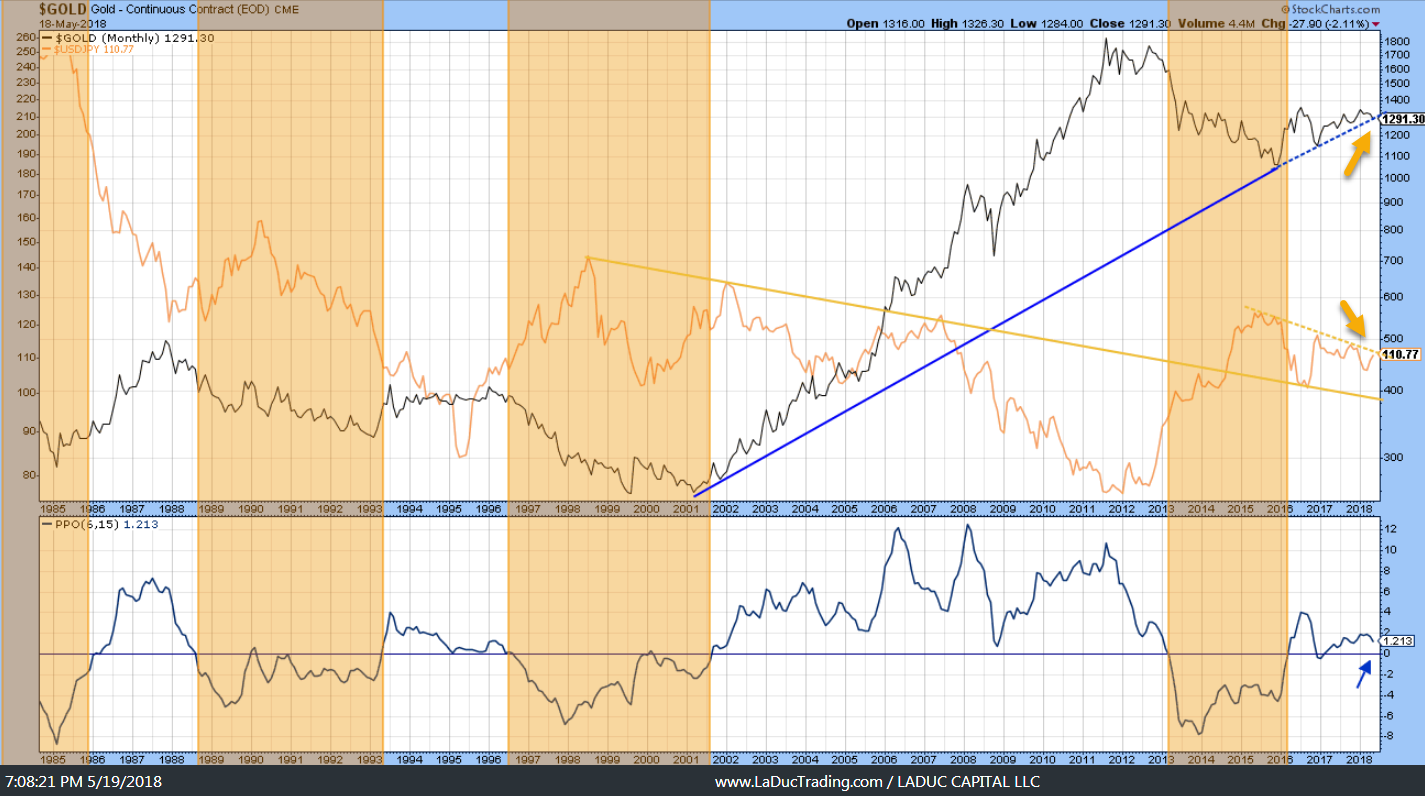
Big Picture with Gold: It’s going to move inversely with the USD/JPY and it’s going to move soon.
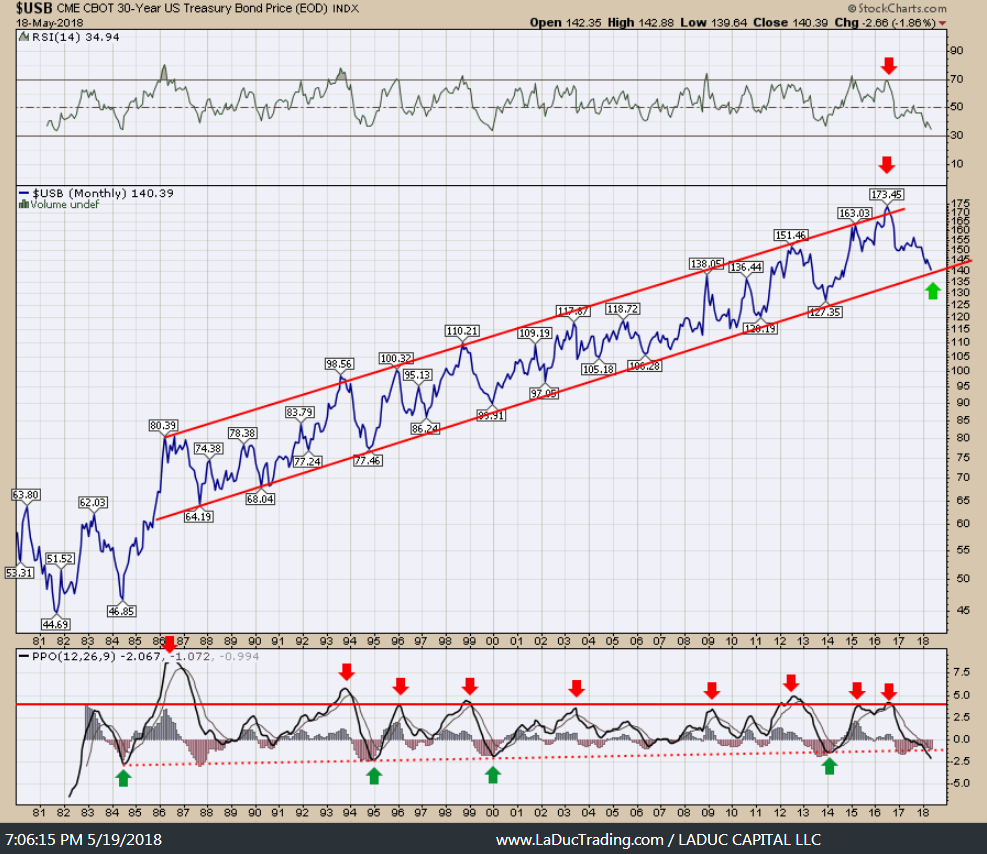
End of Month will be telling as the 30-year Treasury Bond likely tags the 36 year long channel bottom as the Fed approaches its next FOMC meeting in June. Then what? I suspect a short-covering rally in bonds will drive yields lower. The trigger? I don’t know.
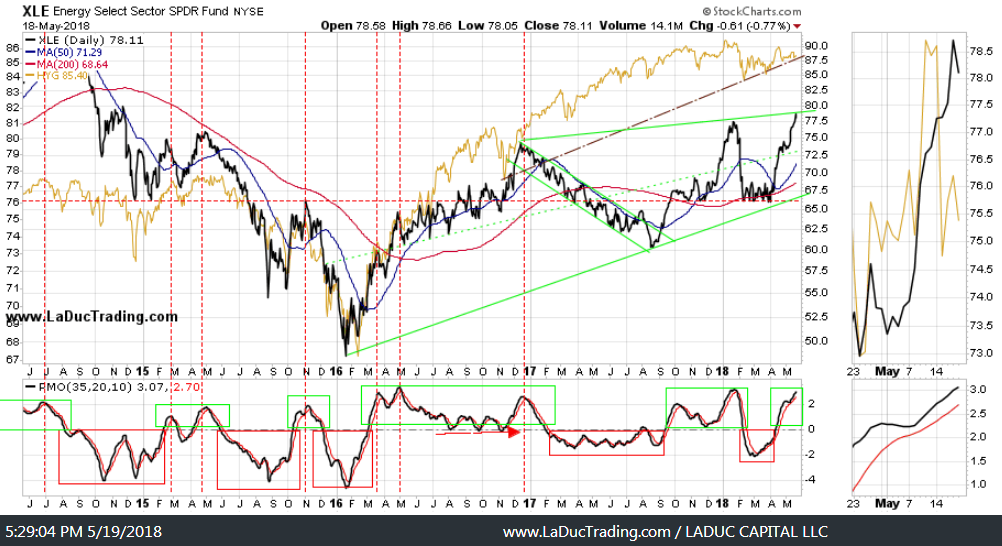
I’m afraid to say XLE should tire up here at monthly resistance of ~$79, because the rally in oil has looked anything but tired. But here is the chart that accompanies a potential reversal: XLE lower with HYG.
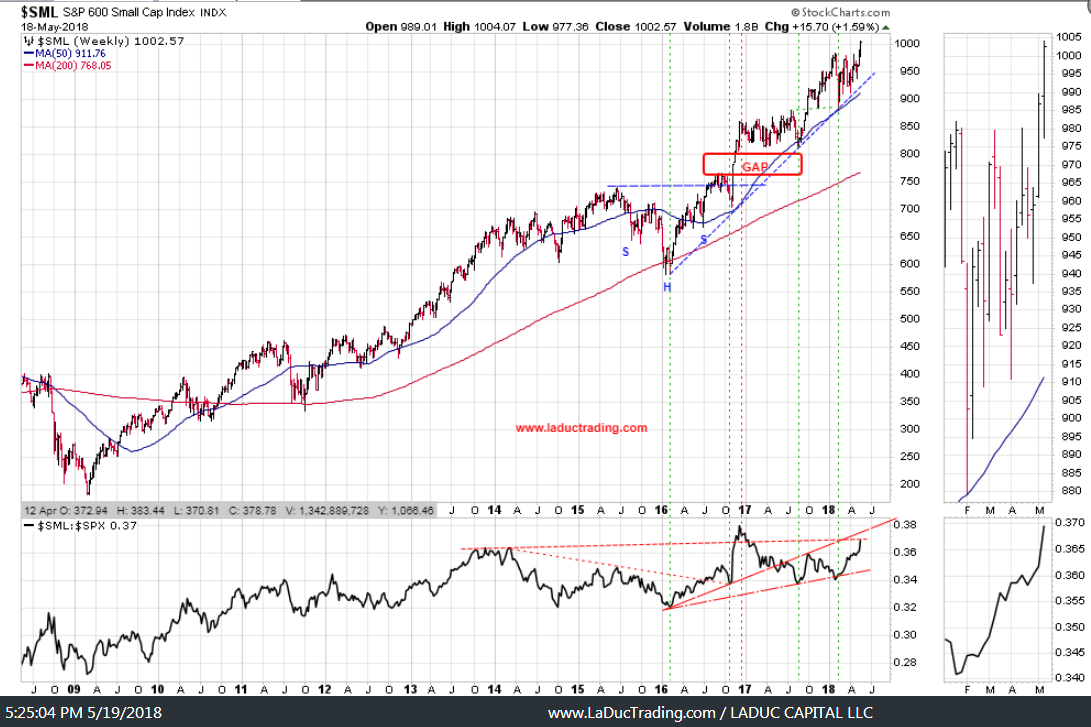
As for small caps, they have done nothing but go up the past two+ weeks as the USD has rallied. It’s a little curious why investors are so excited about the Russell 2000 when it has a P/E of 50x implying negative real forward returns while having the highest exposure to variable rate debt, but hey, this is 1999 redux and all we can do is ride it until it stops.
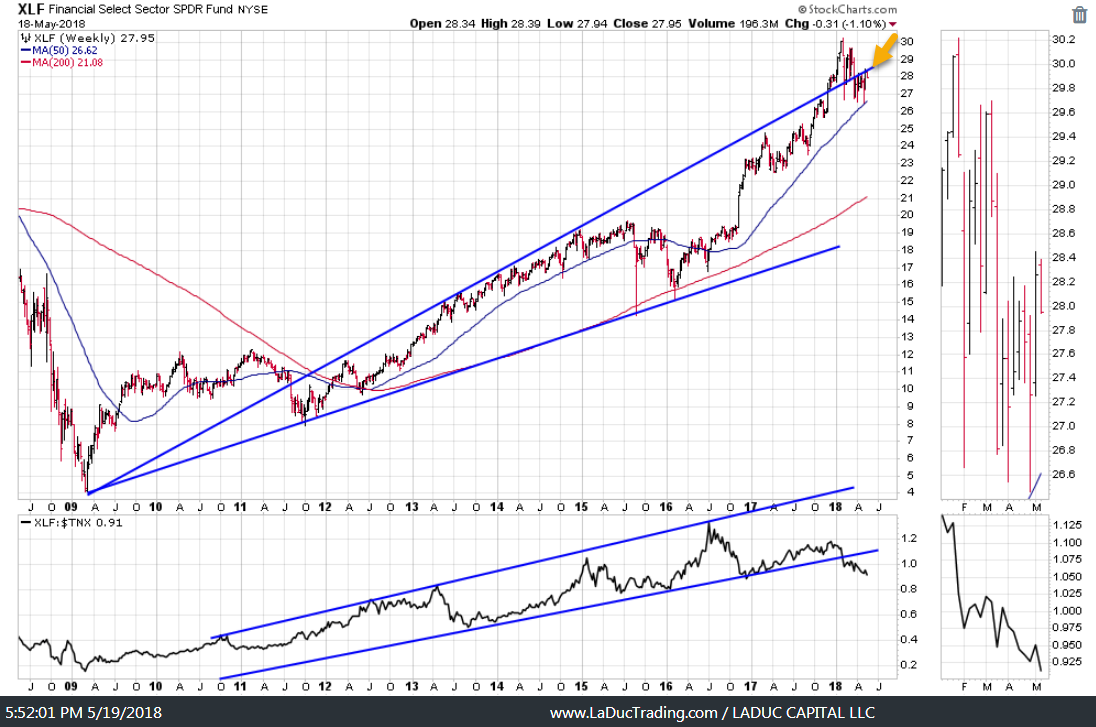
The bank trading desks are giddy with excitement for new revenue (thanks to reduced banking regulations) but the credit tightening from higher rates, flattening yield curve and inflation fears may be causing banks to pause here. Basically, we need to see banks get and stay above this blue trend-line if bulls want SPX $3000 anytime this year.
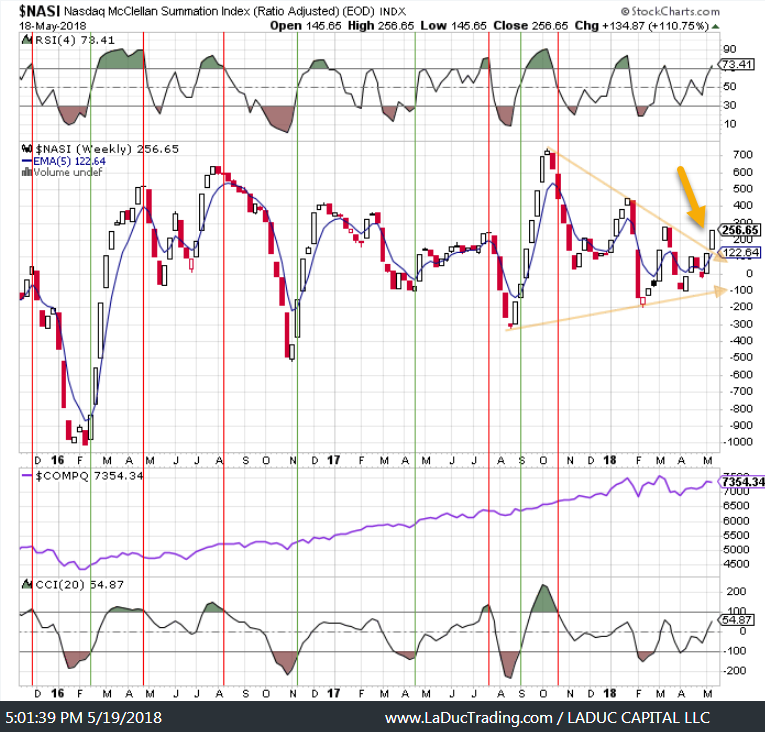
Nasdaq looks bullish if it can keep this breakout going above the triangle.
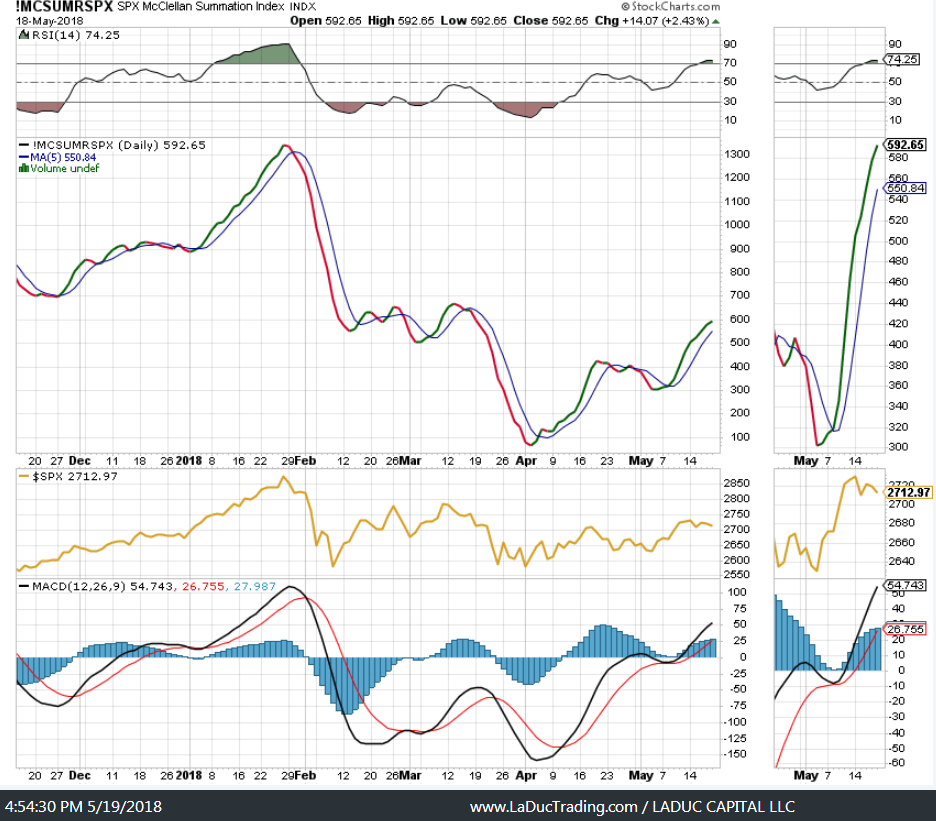
The McCllellan Summation Index for SPX has the momentum finally turning from neutral to positive, but more follow through is needed to be convincing. Barrons recently gave a bullish argument for stocks, citing financial engineering. Here’s how it works: Stock buybacks likely to hit record $650Bn this year which offers investors effective yield of 3% (calculated by dividing repurchases by $23Tn SPY market value). When combined with a 2% dividend yield, investors should get 5% yield in 2018 for buying stocks. Yup, that could be a trigger for convincing follow through. We’ll see.
With that, thanks for reading and please consider joining me in the LIVE Trading Room where we work through Value and Momentum trade ideas and set ups every trading day.
At LaDucTrading, Samantha LaDuc leads the analysis, education and trading services. She analyzes price patterns and inter-market relationships across stocks, commodities, currencies and interest rates; develops macro investment themes to identify tactical trading opportunities; and employs strategic technical analysis to deliver high conviction stock, sector and market calls. Through LIVE portfolio-tracking, across multiple time-frames, we offer real-time Trade Alerts via SMS/email that frame the Thesis, Triggers, Time Frames, Trade Set-ups and Option Tactics. Samantha excels in chart pattern recognition, volatility insight with some big-picture macro perspective thrown in. Twitter: @SamanthaLaDuc