Market Catch September 18 – 22
Check out the highlights from the week that have got us hooked, and what else is down the line!
Theme of the Week – Air Pocket of Risk
Rising yields and dollar, Nvidia earnings and a hawkish Fed have been major drivers of volatility over the past few weeks. Stay up to date with our market insights to see what’s in store as we close out Q3.
Trades of the Week
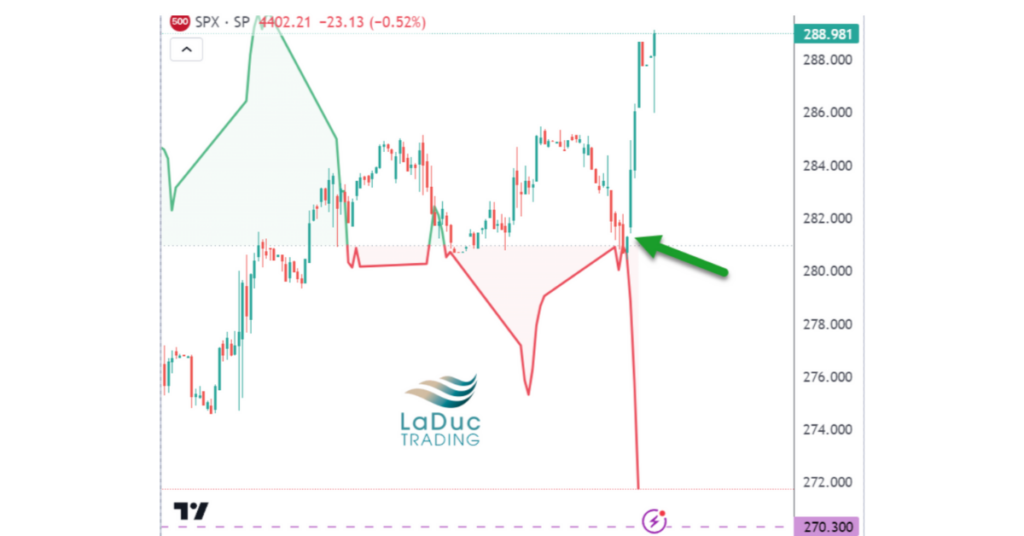
Check in with Samantha’s recent trading room insights on the S&P 500. See how she sized up the market on September 15th to provide timely insight for clients, helping them prepare for a volatile week and be able to take advantage of a great short opportunity.
Chart of the Week
A testament to the power of intermarket analysis, the chart shows the ratio of DXY/10Y spiking higher inversely with SPX. This is just one of her many indicators that warned of more selling to come.
Macro Rundown
FOMC
Markets reacted with volatility this past week after a hawkish Fed priced in two rate cuts from their forecast, implying the neutral rate would move higher while extending the Fed Funds rate for end of 2024 to 5.1% from 4.%. Fed swaps show traders pushing back first rate cut to September 2024. In this week’s Macro-to-Micro Power Hour: FOMC Special Commentary & Analysis, Craig shares his views on what he ultimately sees as a Fed that is going to be tighter for longer into an economy that is seeing potential for re-accelerating inflation. There is a clear stickiness in core inflation from a tight labor market and growing collective bargaining power, which will prevent the Fed from adding accommodation yet to what has clearly become a slowdown in consumer spending that is only going to be getting worse in coming months. Furthermore, with higher energy prices crimping growth in Europe, Craig think we have growing risk of stagflation outcomes with draining liquidity that will be very tough for risk assets to navigate.
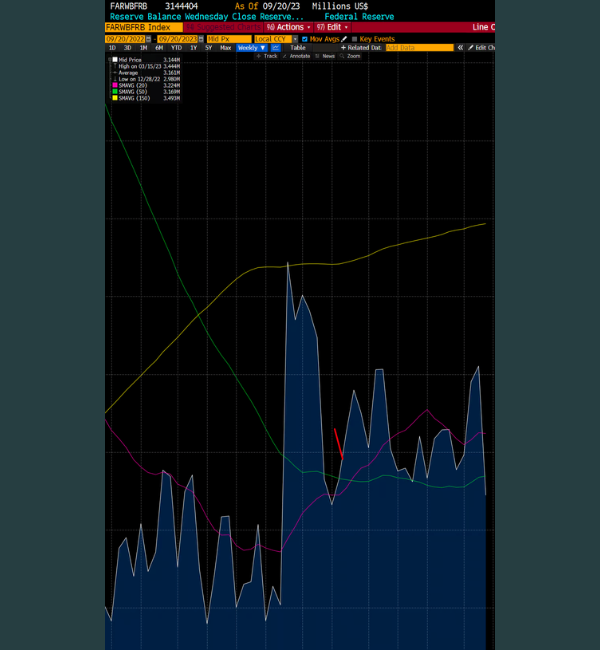
Quarter End Liquidity Drain
As Craig highlighted in his tweet, this past week there was a sizable drop in bank reserves on back of the rise in the Treasury General Account and the beginning of some quarter ending window dressing keeping funds sticky in the high yielding Reverse Repo. The chart below shows that reserves are down $166 billion week over week. Seeing as the Treasury has $134 billion of duration to sell this week, the risk of Reserves heading back to the lows of the year for quarter end remains. The liquidity drain is real with the window of weakness opening up post expiry while bond yields and the dollar continue to move higher. As we move closer towards J.P. Morgan’s quarter end hedged put strike of 4210, there is a real risk of equities repricing the “higher for longer” stagflationary backdrop.
Rithika’s Weekly Trade Ideas
Here at LaDucTrading, we have a dedicated team of contributors who provide clients with trade ideas and educational material that explain the detailed analysis behind their trades. Rithika specializes in Elliott Wave Theory and leverages her combination of technical and fundamental analysis to trade options. See what’s on her watchlist for this week!
Never miss a trade
Learn more