Timing Tops and Bottoms: Are We At One Now?
This is not the first time I asked that question in a post. In fact, I posted my thoughts on the subject back on January 30th, 2022 – Timing Tops and Bottoms: Are We At One Now? -right after so much excitement circulated around buying tech after Nasdaq had pulled back 17%. Have a look – advice still stands:
“My point: we had A LOT OF GROWTH SECTORS TOP back in Feb 2021 and they need A LOT OF TIME TO BOTTOM now. Yes, eager buyers may show up to buy what’s on sale, but they aren’t picking a bottom; they are trying to make it. Let them.”
Yes, LET THEM.
Fast Forward and tech continues to be a wreck.
I also warned then that this Nasdaq underperformance would need 1-2 yrs to fall, stop falling and form a proper base before turning higher. We are only 10 months in and still no bottom has been found in my opinion, despite some stocks having seemingly reached capitulation – like AMZN or NFLX retracing 5 years of gains.
Given my intermarket warnings in 2021 and the ‘fake break-out fast-failure’ set up in November 2021, I assembled my analysis that formed the basis for my very non-consensus call the 1st of the new year that markets would fall 20% in 2020. We did.
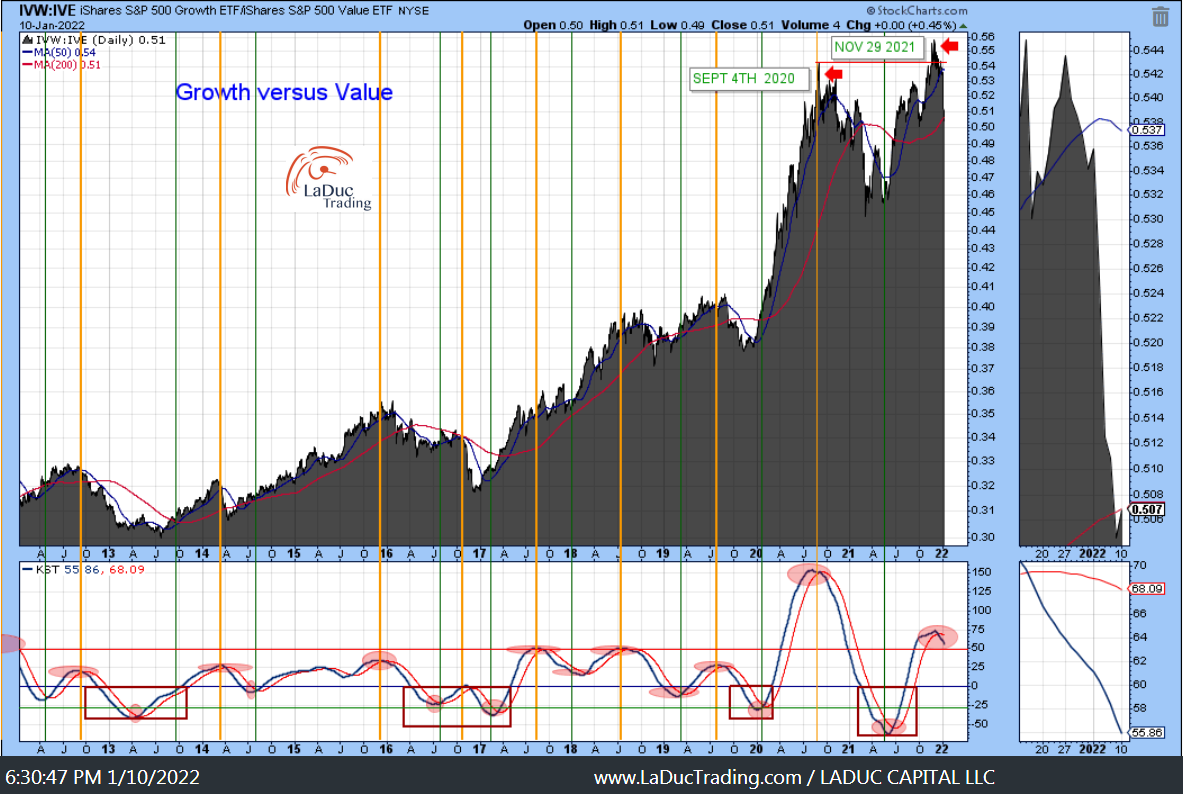
Here it is again – you will notice some of these charts are updated below: 2022 TOP PREDICTION: Growth To Value Rotation Continues
My baseline bet, in short, was that we would continue to ‘dance down the mountain” in the same way we danced up, and that Value would Outperform Growth.
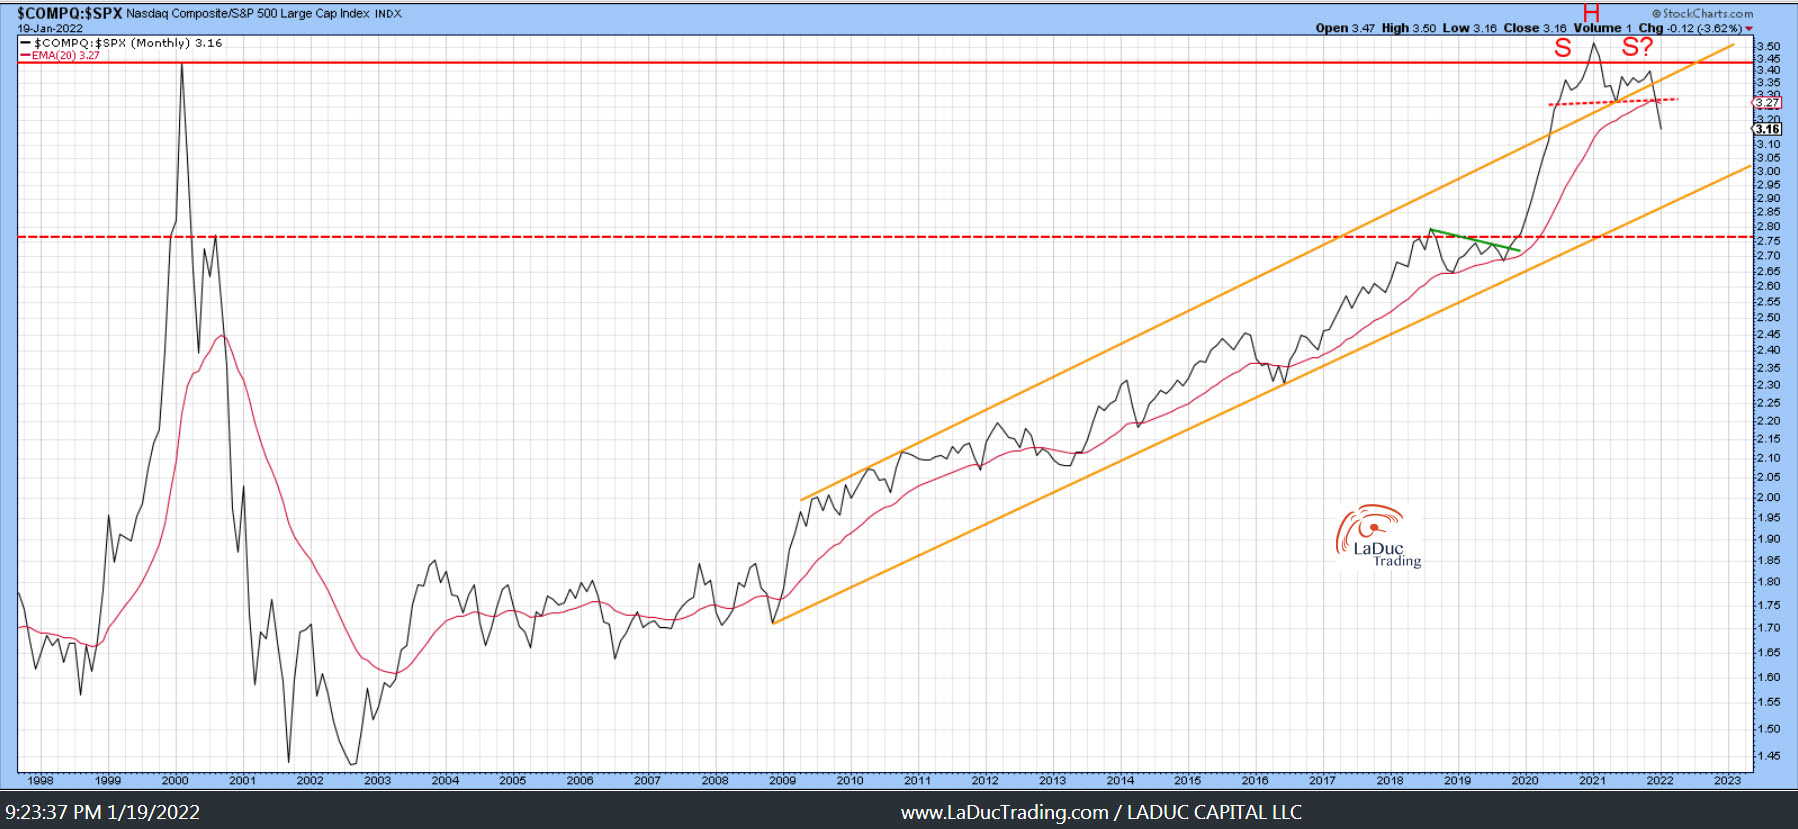
JANUARY 2022
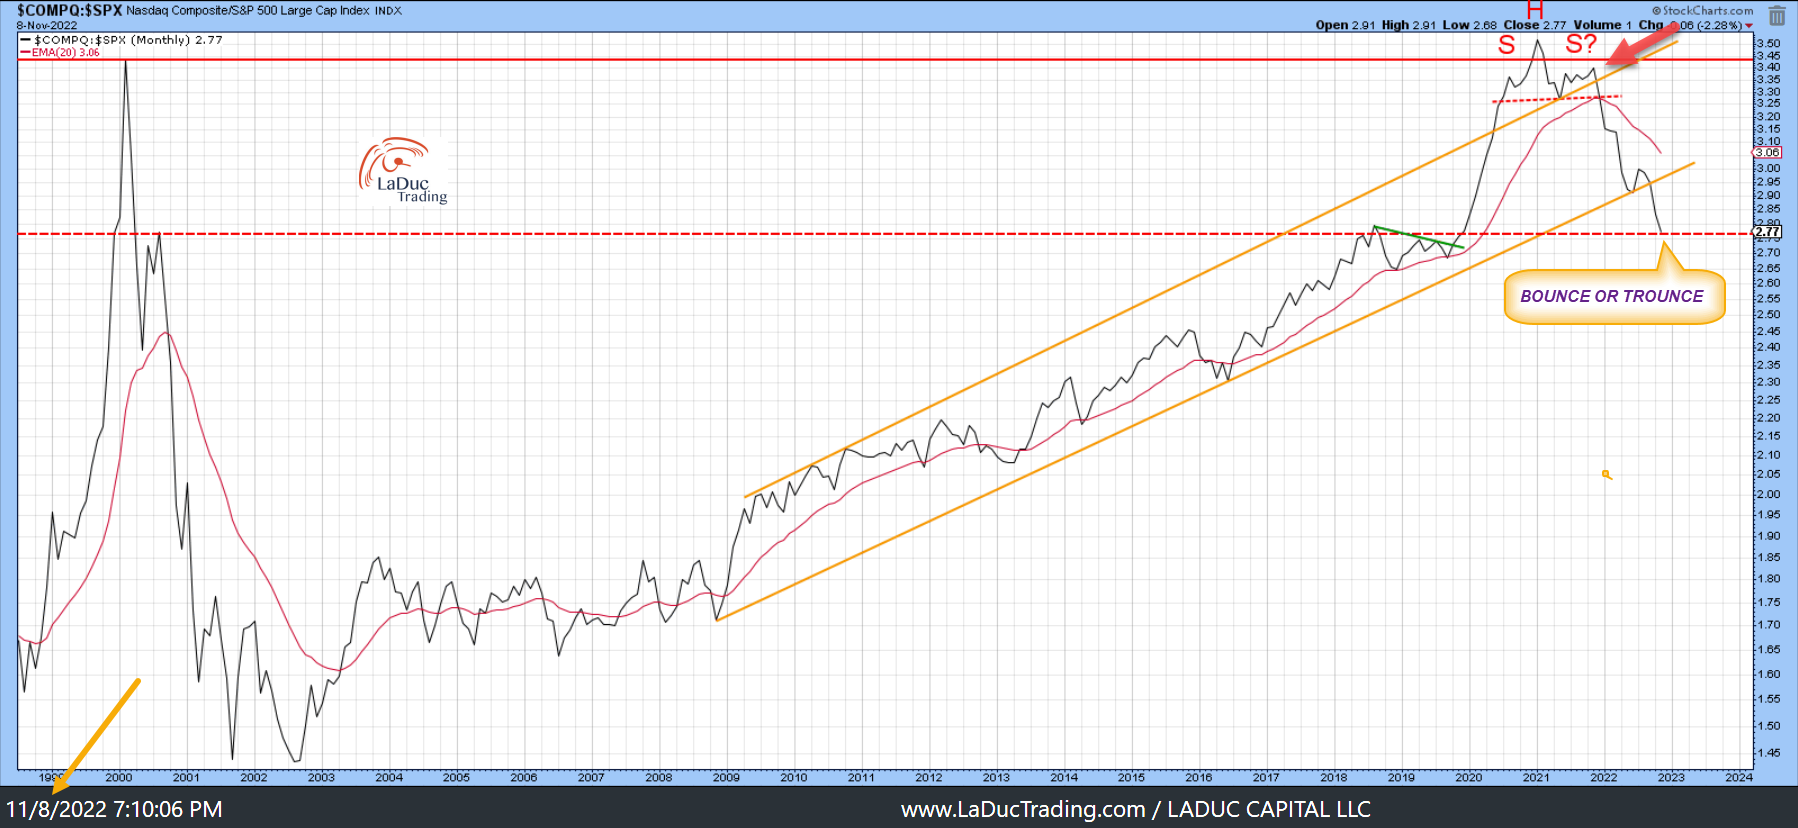
NOVEMBER 2022
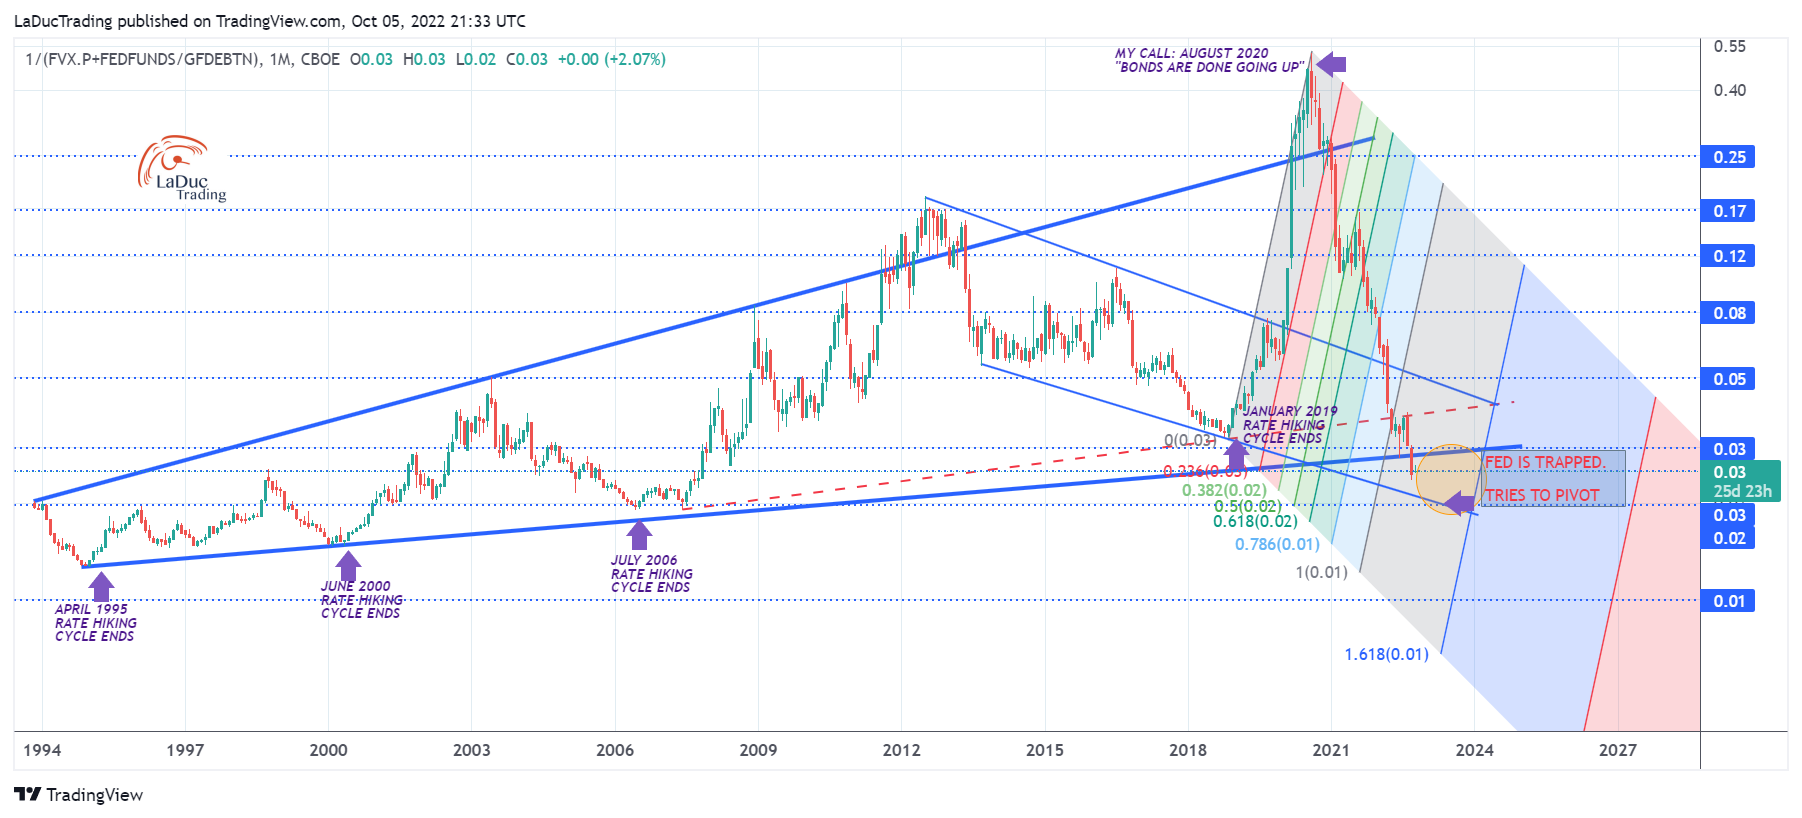
The first wave was actually in 2020 when I made my call in AUGUST 2020 that “Bonds are done going up.”
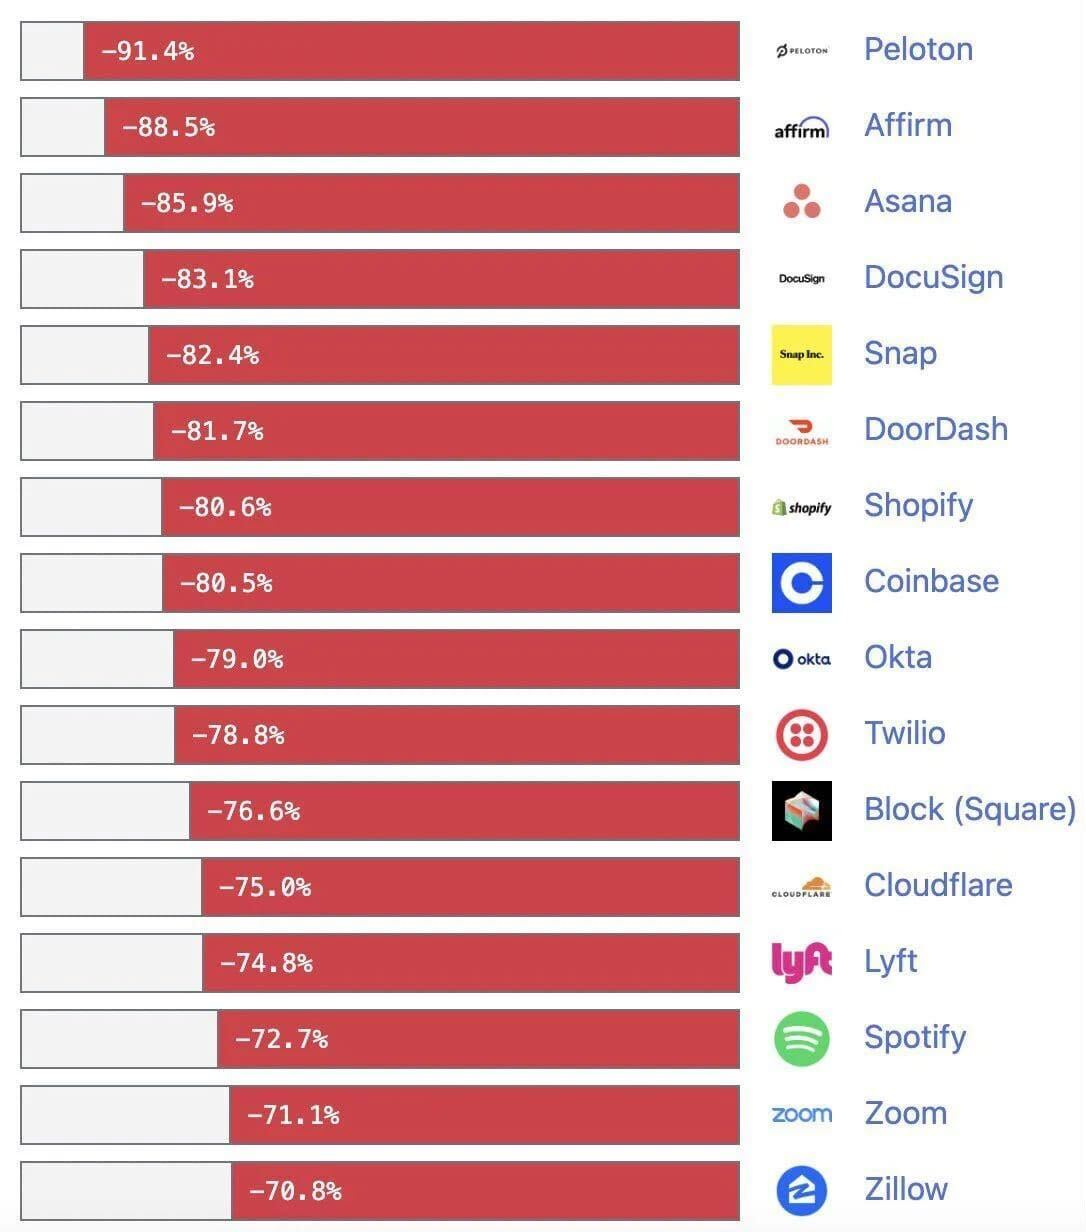
The second wave happened in large part under the surface in 2021 with many highly speculative sectors – IPOs, SPACs, KWEB, EVs etc etc – crashing into protracted downtrends while megacap tech held indices firm to higher.
The third wave hasn’t happened yet but I contend is about to. This next wave lower in tech could be like the one in 2000 when finally, after all the speculative tech blew up in early 1999/2000, the generals like CSCO finally succumbed to forced selling – taking everything lower. Today, that would be AAPL, TSLA, MSFT, GOOGL and Semis like NVDA, AMD, etc.
So buying tech long for more than a trade, is risky business, despite some oversized bounces that make some wonder if this is the bottom of the bear market or just another bear market rally.
Short-Covering Squeeze for the Record Books
Just recently, we had a rally of size that prompted me to remind clients to pace themselves.
From Friday November 11th:
Did China re-open? No. Did Russia withdraw from Ukraine? No. Did a periodic adjustment to healthcare cost segment pulldown CPI triggering a bull stampede? YES! (See both of my posts on this from yday/today in #macro-to-micro-support.) First the macro data in a nutshell:
- Headline annual CPI inflation of 7.7 percent, lower than the consensus forecast of 8.0 pct.
- Core annual inflation of 6.3 percent, below the 6.5 pct expected rate.
- Monthly headline/core inflation came in at 0.4/0.3 percent, below expectations of 0.6/0.5 pct.
Next the micro/market reaction:
The S&P 500 gained 5.5% on Thursday to register its biggest day not only in 2022 but in two and a half years! The Nasdaq Composite rallied 7.4%!How huge was it?…a 4 sigma to the topside… which has only happened ~11 times in the last ten years (GS)…the largest 10yr treasury move since the Fed announced its initial Treasury QE program in March 2009 (JPM)…non-profitable tech had the biggest up move ever (Bloomberg/GS)…financial conditions index was the 3rd largest on record (GS)
My favorite outlier reference and analysis is offered up by Tier1Alpha:
- Yesterday was the worst daily mispricing of the one-day straddle in history by a wide-margin.
- A beat of 0.2% for a CPI that has actually accelerated MoM for the past few months (see below) managed to behave in a manner that exceed the actual emergency rate cut in January 2001.
- That move was given back over the next two days before a rally finally ensued to take the markets marginally higher before turning down against the 100d moving average.
- Short-dated options continue to dominate as 48% of all SPX call volume yesterday took place in 0DTE contracts.
- 0dte options and levered ETFs (and passive) all contribute to the same phenomenon: an increasingly inelastic risk market. Small changes in demand or supply are driving historically unseen price moves.
Oh so 2000-esqueI would say this price behavior is more in keeping with the volatile euphoric melt-ups from 2000 and 2008, just before the brunt of the fall. So far, the controlled downside we have seen this year has been softened from timely USD swaps and VIX suppression as well as timely BOJ interventions. No question this has helped alleviate the most recent global bond crisis that has triggered pension stress and sovereign credit crisis fears.Just keep in mind: the biggest one-day gains in stock market history have come in bear markets, not bull markets.
Nasdaq Underperformance Still In Play
From Jan 2022 to today, my baseline bet remains:
2022 TOP PREDICTION: Growth To Value Rotation Continues
And here we are snaking around $3800 SPX – my market call for 2022 – since May! Just because we had the BOJ intervention October 21st and just because the non-profitable tech basket tracked by Goldman Sachs surged by 25% in 2 days of last week (its best two-day jump in history), doesn’t mean I’m any less bearish tech.
In fact, I continue to see that daily/intraday market structure – like “macro-factor short-covering” by quant/CTA/hedge fund/dealers via buying the S&P500 futures and covering ETF shorts – as the reason for the season. That and USD moves and DXY swaps. I wouldn’t even be surprised if some of this performance can be attributed to hedge funds covering profitable shorts to play catch up from poor performance YTD, exposure to the #cryptocrash, and/or FX/Treasury volatility causing this recent forced unwind in rates. But in no way does it change the Big Picture assessment that Nasdaq is way underperforming and is likely to continue.
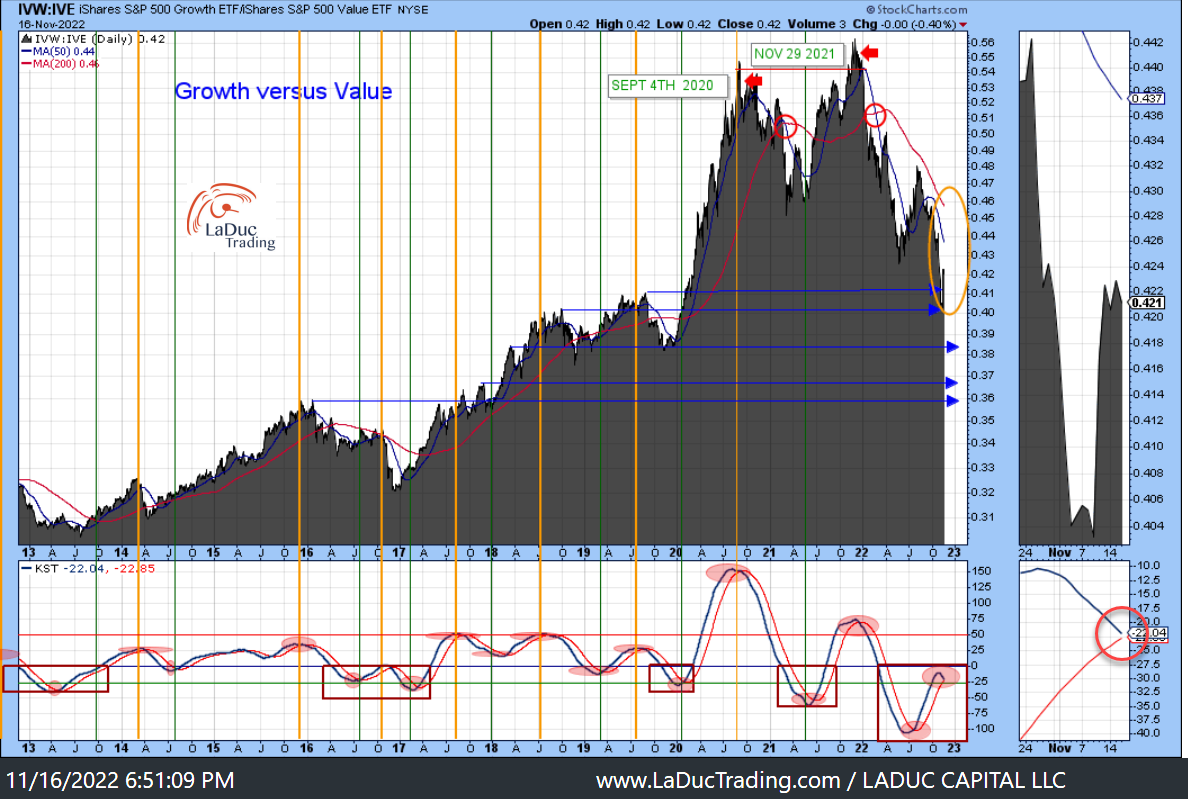
Here’s how that tech unwind looks from my #IntermarketTells: In a word, “predictable”.
JANUARY 2022
NOVEMBER 8, 2022
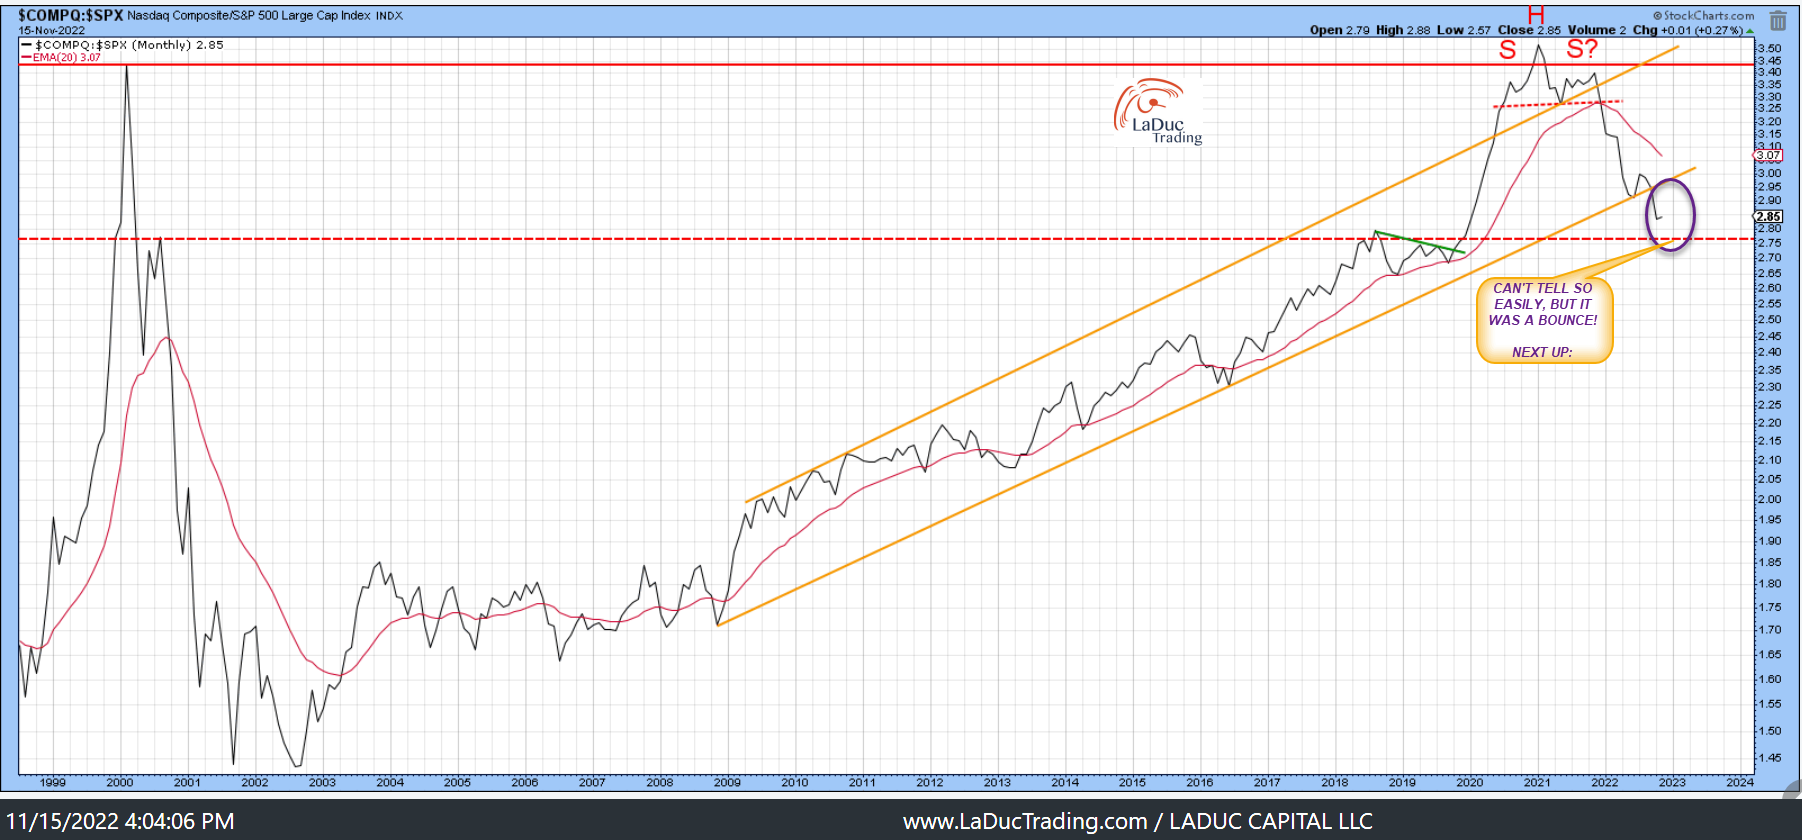
NOVEMBER 15, 2022
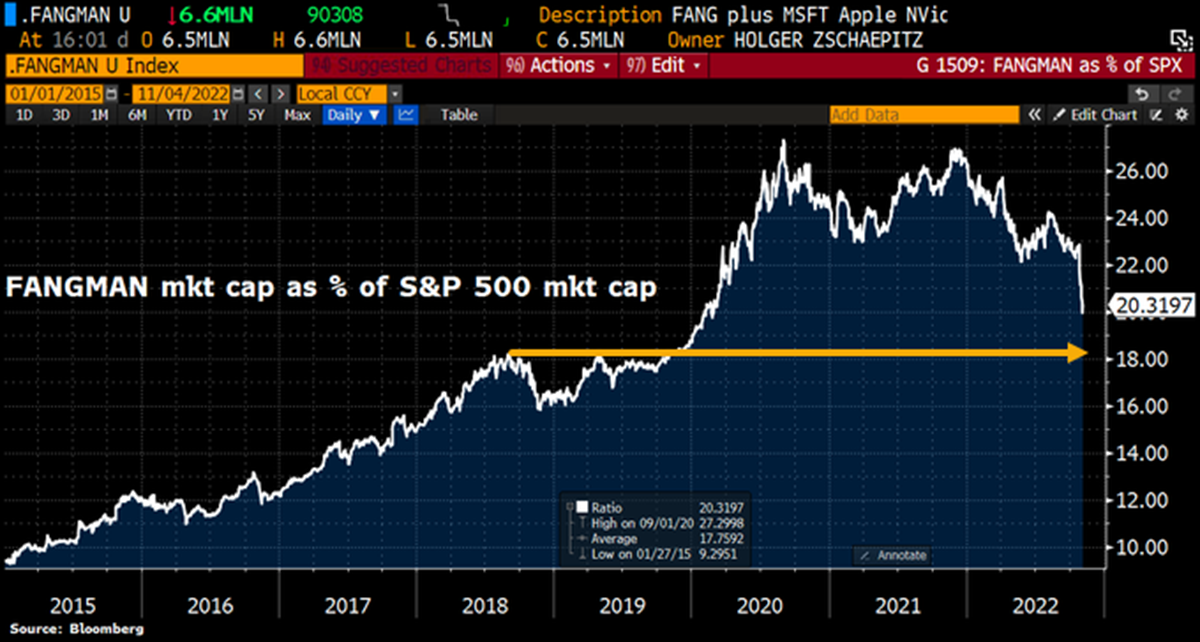
Does Mega Cap Tech Matter?
You know they do and for good reason as they sit on every passive index, mutual fund, major portfolio and even some national banks (Swiss National Bank)!
Case in point: NYFANG (FANGMAN market cap) continues to falter and still has room to fall to 2018 highs. As far as I’m concerned, we are still getting the ‘bubble’ valuations out of the mega cap tech stocks. We haven’t even priced in margin compression let alone recession yet.
MACRO MATTERS TO MARKET RETURNS, ESPECIALLY TECH
“We are all rates traders now”, is a common refrain of mine the past two years. I also have a saying clients have heard often that “USD makes the weather” and with that, “Rate of Change determines the severity”. Both – higher USD and RATES, have contributed handily to Nasdaq underperformance. Currently, we can see some large swaths of consolidation/digestion in the short-term with a directional change in USD, RATES (and even OIL) to the downside, but my medium to-long-term view is that all three are structurally bullish. As such, my early 2021 market call for Growth-to-Value Rotation is still in play. I continue to see energy outperforming tech for the next year at a minimum.
I don’t see from my macro, intermarket or technical a cyclical top in DXY nor do I believe the Fed will pause (stop hiking) or pivot (cut rates) without spiking oil.
And this macro framework determines my assessment that tech has even farther to fall… Even if it appears the market is ignoring “higher for longer” rate hikes and pricing in rate cuts (but not a recession), and … Even if Goldman Sachs expects no rate cuts or recession!
With that, I am on the lookout for a resumption of an economic turndown and growth scare. Maybe it’s from a geo-political risk that is difficult to time. More likely another energy strain from spiking oil. In fact, of the three – USD, RATES, OIL, oil is the most ‘dangerous’ because it’s the one input Fed/Treasury is least able to control.
But the biggest risk is the predictably higher rate regime in RATES, akin to “Frog. Water. Boil” – where we go higher, slowly, and there is no escaping the fact water is getting hotter. There is also no escaping that the Fed is purposefully intending to orchestrate lower consumer demand and higher unemployment. As a result, I see this scenario as more The Grey Swan not Black.
Nassim Taleb:
“A grey swan is a highly probable event with three principal characteristics: it is predictable; it carries an impact THAT CAN EASILY CASCADE (emphasis mine); and, after the fact, we concoct an explanation…to errors in (human) judgment”
Translation: slog sideways to lower with risk of cascading.
Until then, it seems clear it is a mistake to buy Tech when the Fed has clearly talked/walked more hawkish in their attempt to stem inflation by continuing to hike rates until demand has been sufficiently crushed. When that will be is unclear, but until then, tech is not safe.
GDP – Growth Matters to Growth Stocks
Just so happens that this week Bloomberg released their November survey of economists for global growth over the next three years:
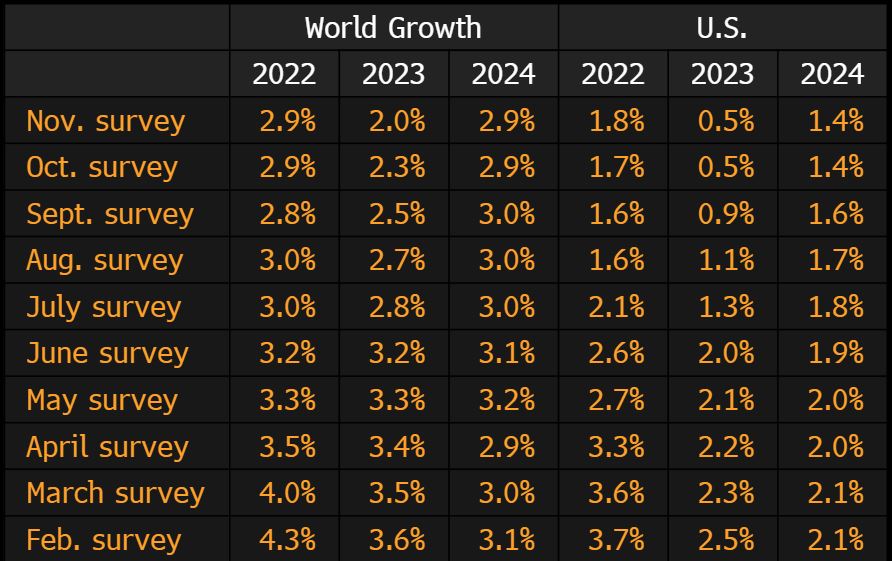
As Tier1Alpha recently summarized, the cumulative downgrade goes all the way into 2024:
In the February survey, expectations for global GDP growth over the ’22-24 period were for 11.4% over the next three years. Today, that number has been lowered to 8% cumulative. These are huge numbers.
What does this suggest? While things got marginally better in the near term since October’s market low and recent CPI and PPI releases lowered inflation expectations, they have gotten much worse in the long term. Suffice it to say, the pain of slower growth lies ahead.
Given the continued expected hit to economic growth, housing and unemployment – whether Fed tips us firmly into recession sooner rather than later – I contend: Recession is not priced into the market, and since mega cap tech makes up the largest weighting for SPY, recession has not been priced into tech.
Rolling Inflation Peaks & Equity Bottoms
My bet stated to clients has been that I expect: “Waves of inflation peaks and equity bottoms in 2022-2024″ .
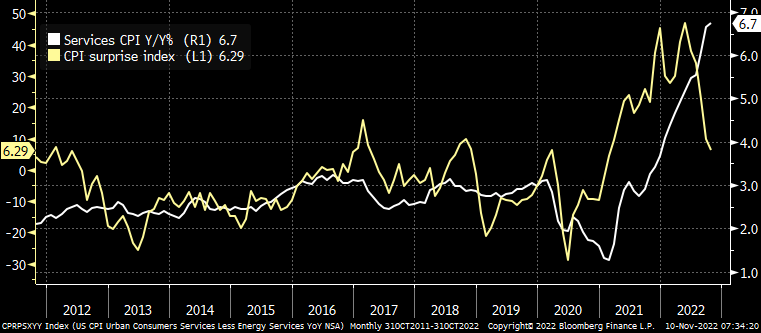
Market recently got excited about weakening CPI and PPI readings. These contributed to the knee-jerk reaction to USD and 10Y yield pullback, which also happened to correspond well with the timing by the BOJ intervention October 21st. Regardless, inflation is staying sticky big picture, especially services CPI, which is where it really matters as it showcases rising wage costs.
I have written about this threat to bonds: Deflation of Wages Ended with Covid (October 2021). In short, this structural inflation trend is intact and it will awhile before that changes as evidence shows:
“once inflation spikes above 8%, median inflation takes around 2 years to even fall beneath 6%, before settling around that level out to 5 years after the initial 8% shock. This is around 2pp above the pre-shock median of c. 4%” Deutsche Bank
Fed’s Waller sums up the current FOMC rate hiking regime well:
“7.7% CPI inflation is enormous. It’s really not so much about the pace any more, it’s where we’re going end up. And where we end is going to be driven solely by what happens with inflation.”
MacroAlf also posted some key future considerations for the market to consider:
If US Core Inflation halves (!) its monthly pace between now and the next 8-9 months, you are still going to sit in the 3-4% YoY core CPI area. The hurdle for the Fed to pivot is really high.
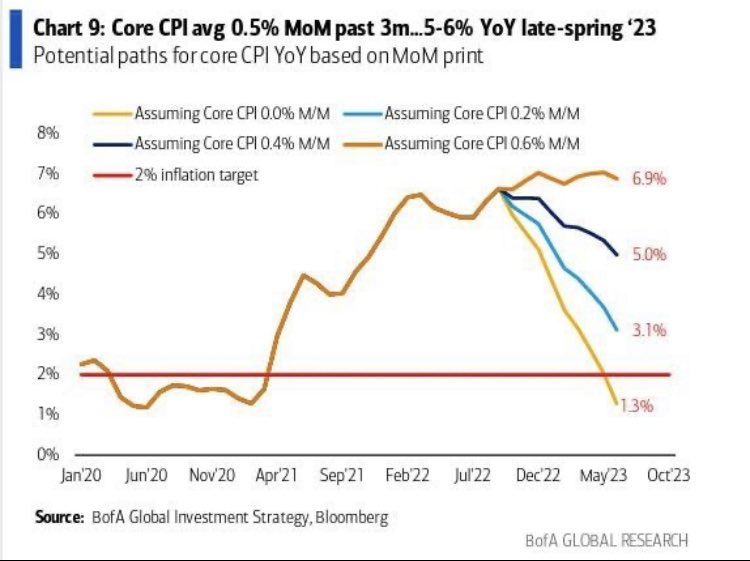
Long story short, there’s a ways to go before rate hikes are done, and even if they step-down the amount, “higher for longer” is still the mantra.
So direction is more clear than duration, but in no way has Fed intonated a pause (stops hiking) or pivot (cuts rates). In fact, Powell continues to warn directly and indirectly of their hawkish intent.
What does this suggest? While things got marginally better in the near term since October’s low, they have gotten much worse in the long term as inflation remains entrenched and Fed lacks the tools to affect this without impacting economic growth, employment and wages.
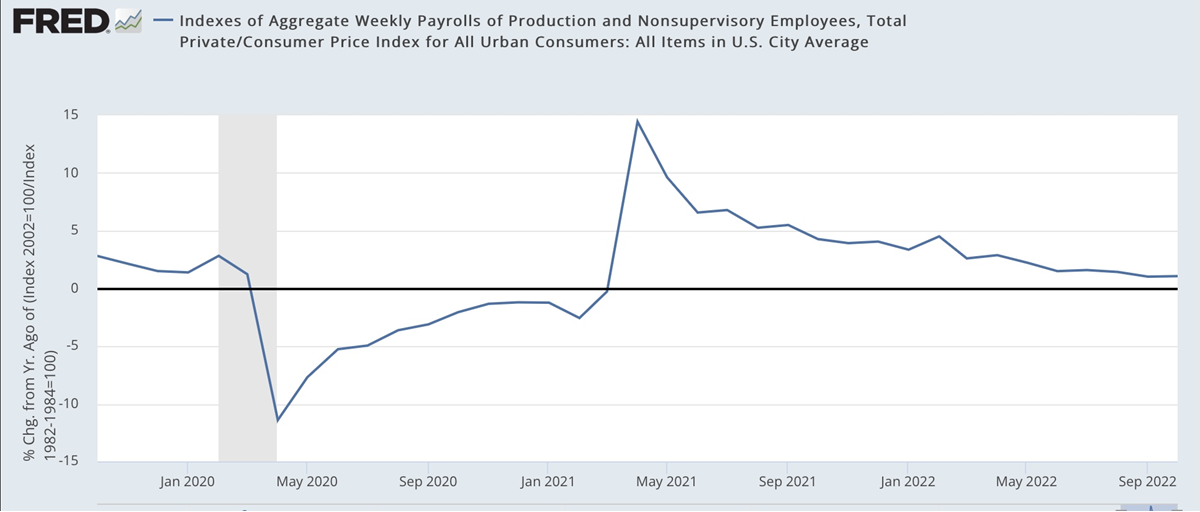
Recession Tell: Part 1 Unemployment
RAP is the real, inflation adjusted, weekly wage for the average working class and lower middle class wage earner. When this indicator has declined on a YoY basis, it has always taken place within a few months of a recession.
David Cervantes of @pinebrookcap reminds:
This indicator has a 100% batting average over the past 60 years.
And it’s getting close to rolling over, but won’t, most likely, without housing weakness.
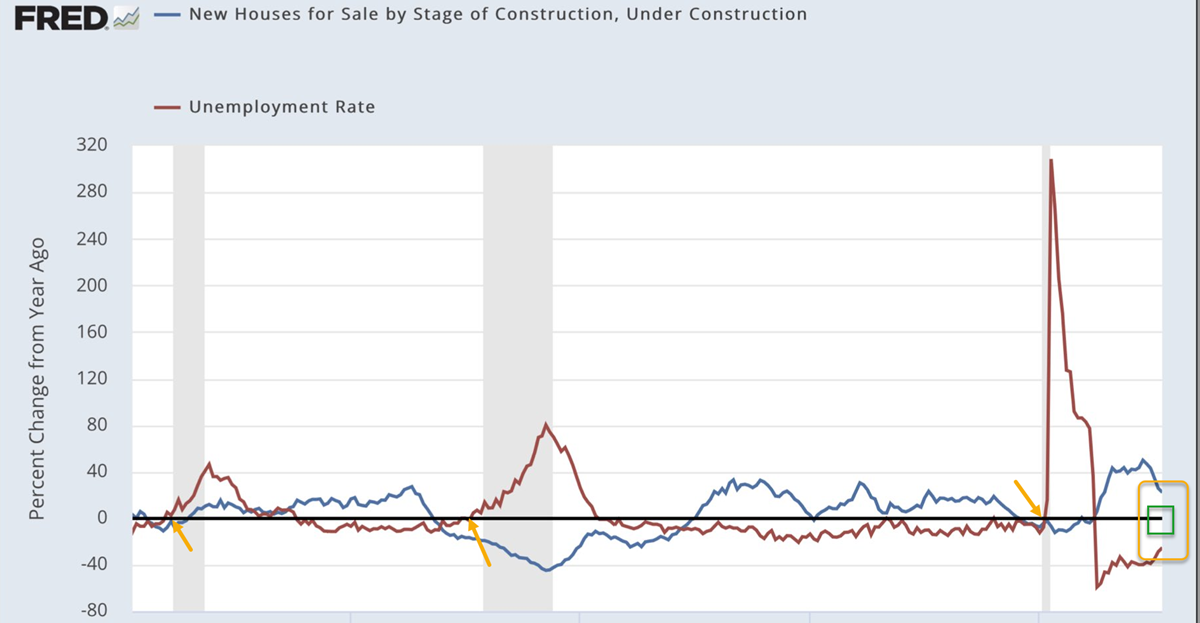
Unemployment is damaging to the housing market and vice versa. Yes, mortgage rates have doubled and housing has entered a recession, but it’s especially important to keep in mind construction contributes real economic activity – upwards of 15%v to GDP – and that drives the business cycle and employment trends.
The pace and timing of housing construction will be the defining factor of when we experience employment and economic contraction. Queue this chart of construction employment and new houses under construction – trigger at 0 line (green box).
Want another perspective? Here’s a great write up on Inflation and Fed path by our resident MacroAdvisor, Craig Shapiro. In a nutshell: Investors shouldn’t count on rate cuts in 2023. And Fed can’t cure inflation without a recession and can’t have a recession without unemployment.
That leads me to corporate earnings and their impact on unemployment.
Recession Tell: Part 2 Corporate Earnings
Since we are all rates traders now, it’s pretty telling how the direction of the 10 year yield index has corresponding very well with Nasdaq returns. And is also why a pullback in yields has triggered risk-on in markets of late. ‘Less inflation means lower rates’ in the minds of market participants, and lower rates (usually) mean higher stock prices. But what about earnings? In the same way that inflation “peaked” in June, so too did corporate earnings – as written about for clients here June 23 2022 projecting an EARNINGS PEAK, with follow up: here September 29th, here October 9th and here November 3rd. In a nutshell, this is not market bullish.
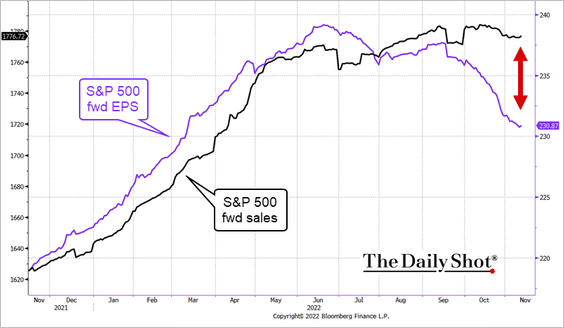
The divergence between earnings and sales expectations have clearly signaled shrinking margins ahead, not to mention wages comprise about 30% of COGS and are accelerating into 2023.
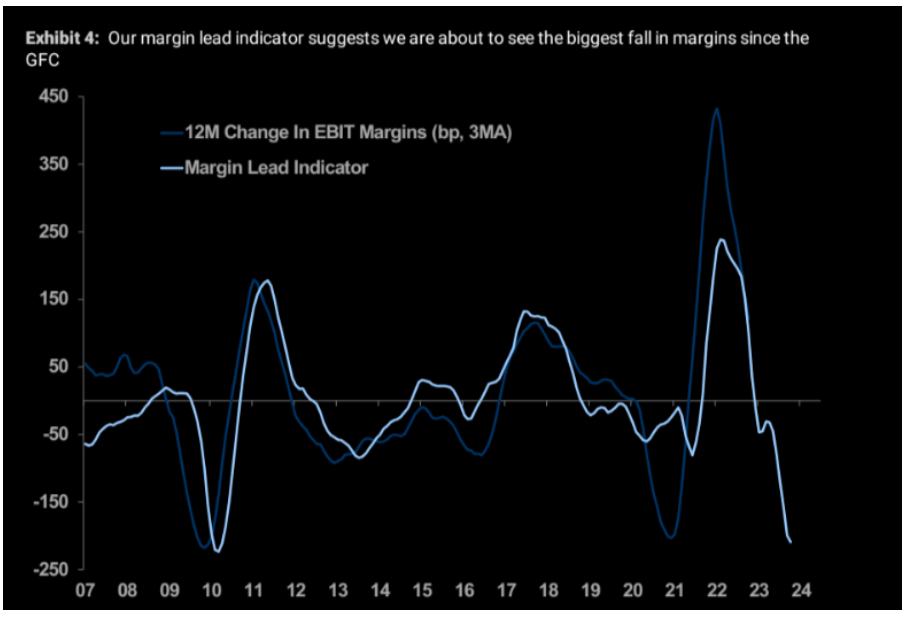
The Morgan Stanley corporate margin indicator warns:
“Our margin lead indicator suggests we are about to see the biggest fall in margins since the GFC”
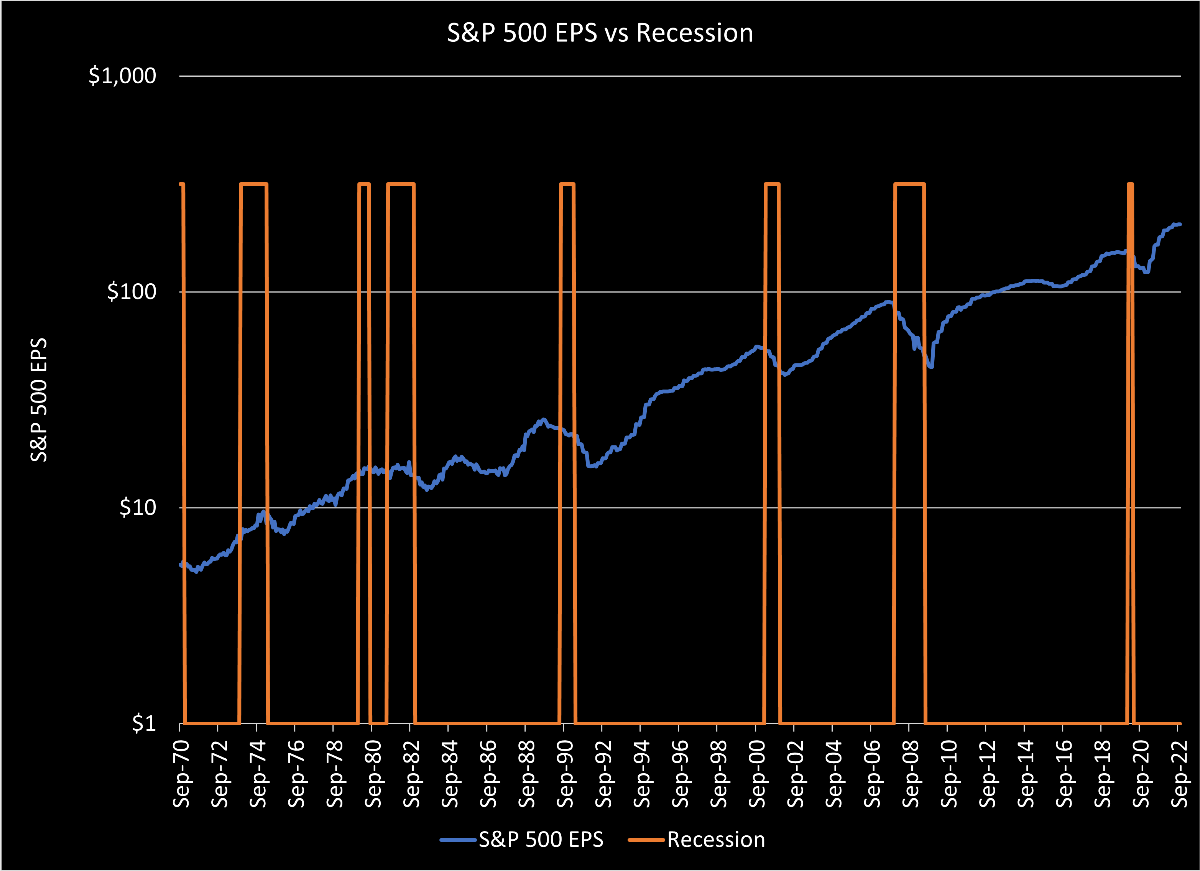
My favorite trend-following chart for position traders – my chart of GAAPSPX – graphically represents the trend of when best to buy and sell the market for trend reversals. Currently, market is still too rich with SPY forward earnings estimates reflecting higher than current earnings levels ($56/share now vs Q2 – Q4 2023 $57 – $60/share).
With that, I expect those estimates to come down meaningfully next year (read: tech), to cause this indicator to pulldown into that monthly trendline (yellow circle). THEN we will have a true test of either a soft landing (bounce) or hard landing (trounce).
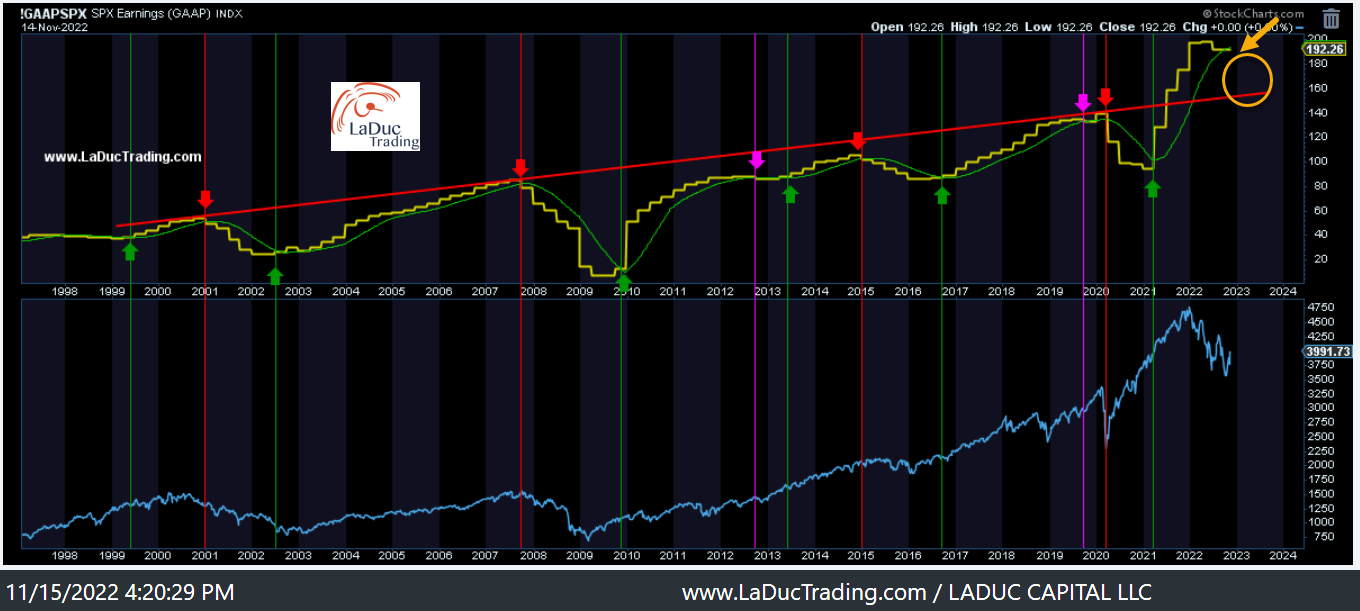
Another look at the really long view: We have moved from valuation correction to peak earnings, but market has yet to price let alone experience a recession.
Recession Tell: Part 3 Inflation Into Deflation
Markets are still pricing in a soft landing, one in which earnings don’t price in a Fed-induced recession let alone growth slowdown. Color me skeptical.
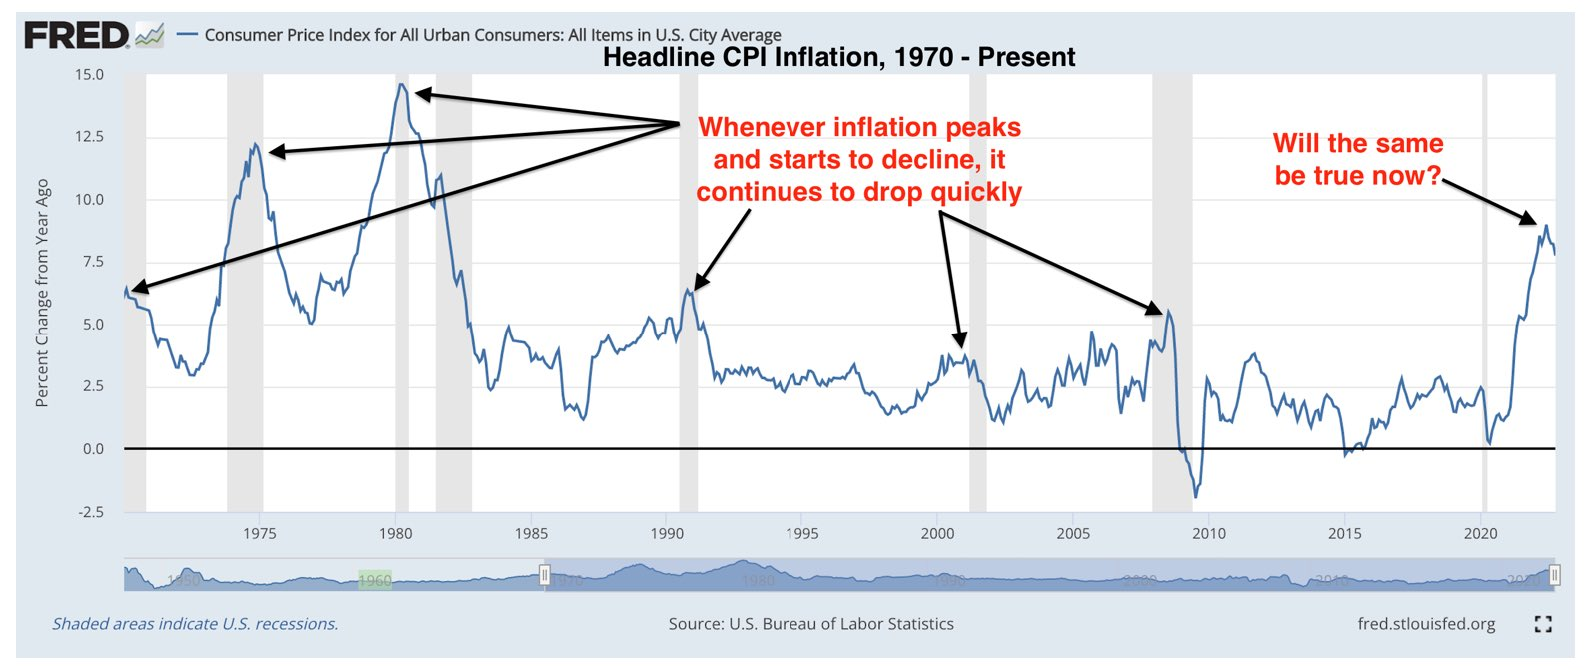
This chart (courtesy Datatrek) highlights the headline CPI inflation data since the 1970s. Even if we have ‘peaked’, is it safe? This chart would imply inflation falling off faster now (assuming energy prices don’t spike higher which is a risky assumption) corresponds with recessions, but market seems to want inflation to sharply fall without deflation of assets and without a recession despite rising rates. Maybe this time is different, but there isn’t a time we haven’t avoided a recession when major inflation rolls over hard.
Recession Tell: Part 4 Yield Curve Inversion
As shown above, ironically, inflation slowing is a sign the economy is edging closer to a recession. Coincidentally, it is the steepening of the yield curve that is triggering the recession warnings the most.
Fed Futures expect the Fed to keep raising rates higher in December 2022 and into Q1 2023, but now think the FOMC will likely be easing in the back half of next year. And yet, just last week Chair Powell said the FOMC would be increasing – not reducing – its expectations for Fed Funds in 2023.
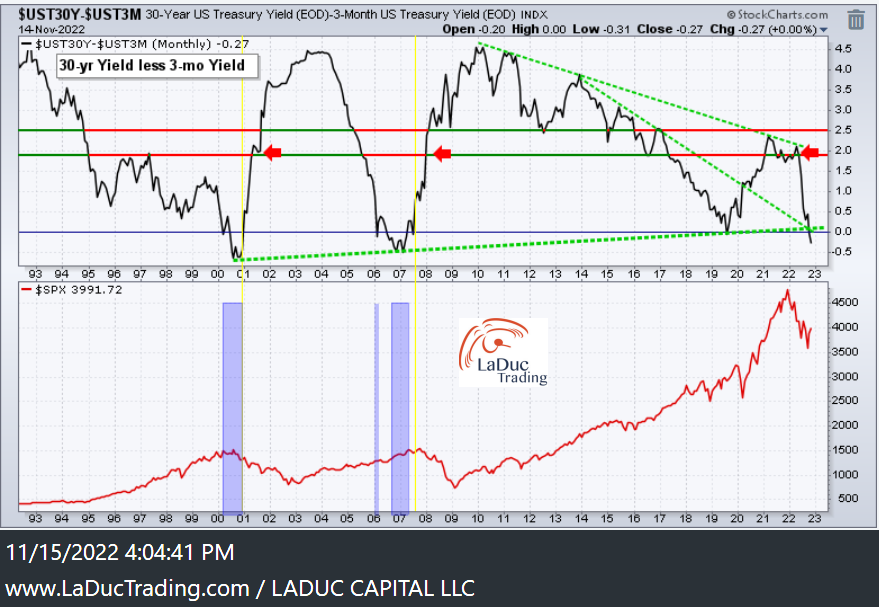
Then just this month, the 30Y-3M Yield Curve Inverted.
I alerted clients in April this year that I expected this rejection in this particular yield curve as I closely track the 3M yield index daily. As you can see, this part of the curve steepened massively in 2000 and 2007, at the beginning of a sizeable recession that triggered equity sell-offs. In both cases, the bond market believed that the Fed would need to eventually stimulate growth via cutting rates and both times the Fed obliged.
Well, we are at the inversion phase again in this instrument, and while equities feel emboldened that the macro landscape has gotten marginally better in the near term the past month with inflation expectations dropping, this indicator warns that the macro landscape will get worse in the long term.
When the 3m yield starts to fall but 30yr yields don’t fall nearly as much, we will have a bear steepener that be an even stronger headwind for housing, consumer balance sheets not to mention growth stock multiples. (Read: Tech).
Recession Tell: Part 5 Consumer Health
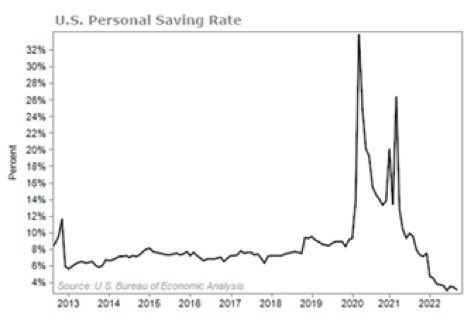
Consumer health is often debated, but there is no debating:
- US personal savings rate is at 2005 lows (see chart) at the same time…
- $1 trillion in credit card debt is at all time high, and…
- Credit card balances increased 15% YoY – their biggest jump since 01’ recession, and if that wasn’t bad enough…
- Average rate on credit cards is 16.27% – the highest rate seen since data started in 1994!
This data – all of it – simply discourages me from wanting to hold even more paper (read: tech).
Does a Fed Pivot Fix This?
In a nutshell, my call in August 2020 that “Bonds are done going up” – based on my intermarket analysis – hasn’t changed. After an historic bond crash, I still contend, Fed is not done. My latest call since August 2020: “Fed has already overshot! Fed is trapped.” And this is what forms the basis of my call for higher oil if Fed even intonates a pause or pivot.
Here’s where they are really trapped: Markets could crash and Fed could step in to talk/walk back some rate hikes: WATCH OIL. This game of cat-and-mouse with markets pricing in a Fed pause/pivot will only get oil bid as oil remains the best inflation hedge. And as oil shoots higher, this will force Fed to revert!
This is a period that will frustrate both bull and bear.
Ultimately, this is a game of damage control for the Fed.
- Inflation is STICKY & STRUCTURAL so Fed must tighten to crush demand.
- Monetary tightening IS designed to CRUSH demand, HURT returns and DESTROY wealth, so growth will continue to FALL GLOBALLY.
- As growth declines, that puts the world on the brink of RECESSION.
- An ENERGY CRISIS only speeds recession up and makes it worse.
My view: Goldilocks is dead.
We have inflation at 8% and unemployment at 3%. Fed wants to reverse that: 8% unemployment and inflation at 3%. How is that bullish tech?
Last but not least, if a Pivot is what the market wants, they need to be careful what they wish for… a formal Fed Pivot (rate cut not just pause) has historically caused equities to sell-off even faster. And that’s where the well-tested expression comes from as a Rule of thumb on Fed Pivots:
Don’t buy the 1st rate cut; buy the last one!
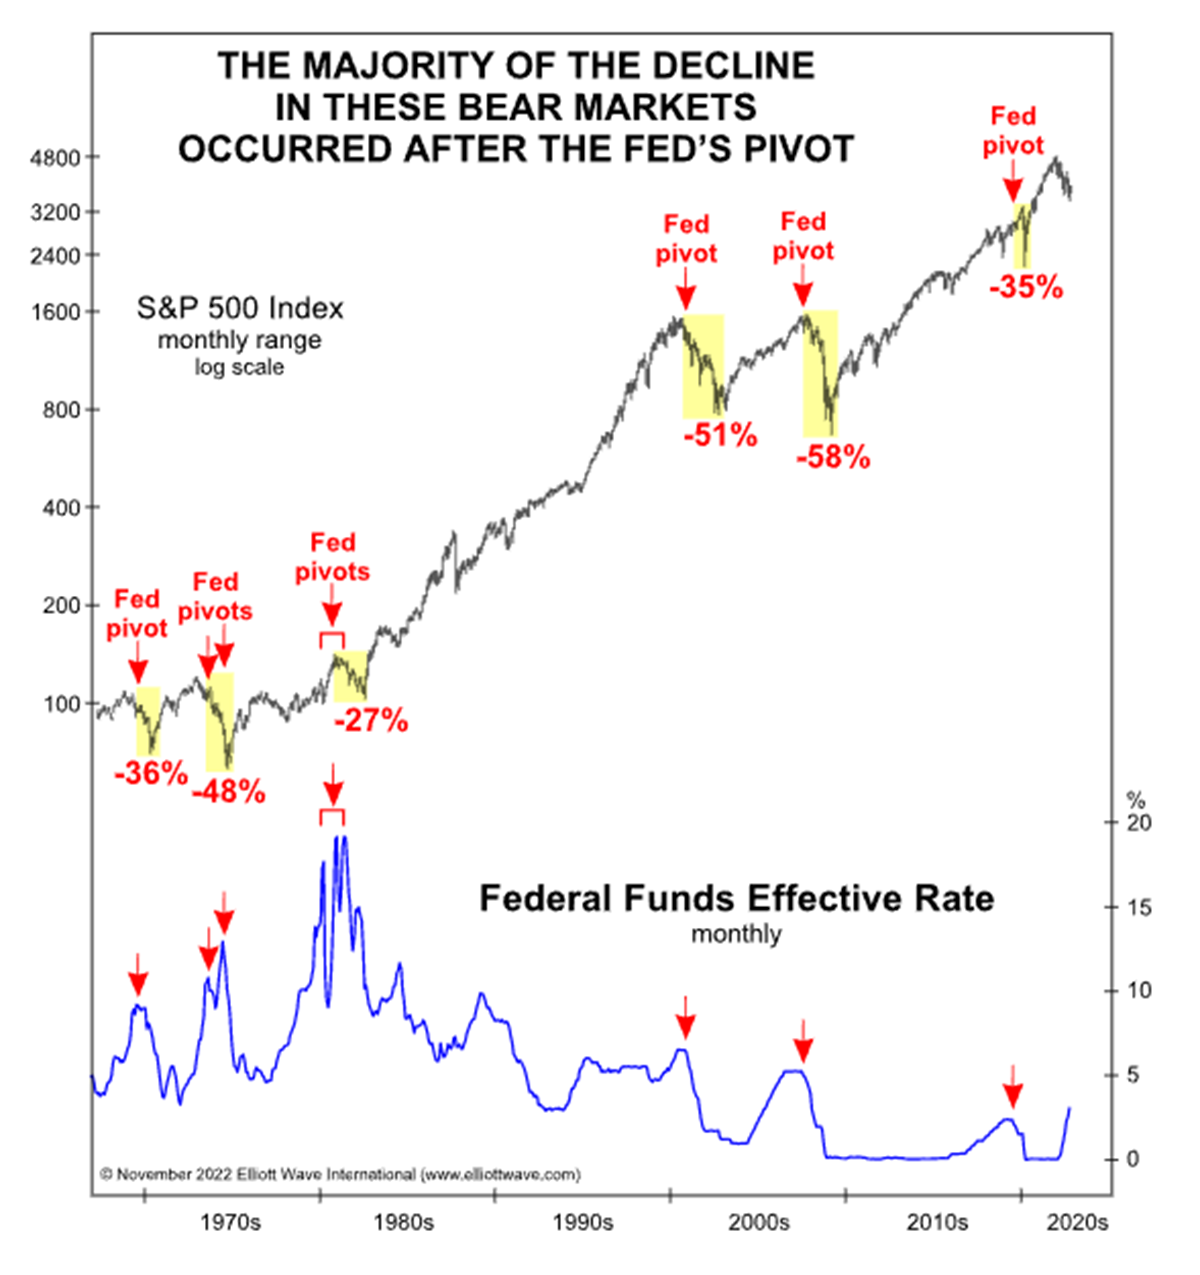
So 2000, 2008!!
I posted on twitter my sentiment that:
- GLOBALIZATION
- DEFLATION OF WAGES
- RISK PARITY
- TINA…
all died with Covid.
- Next: FOMO
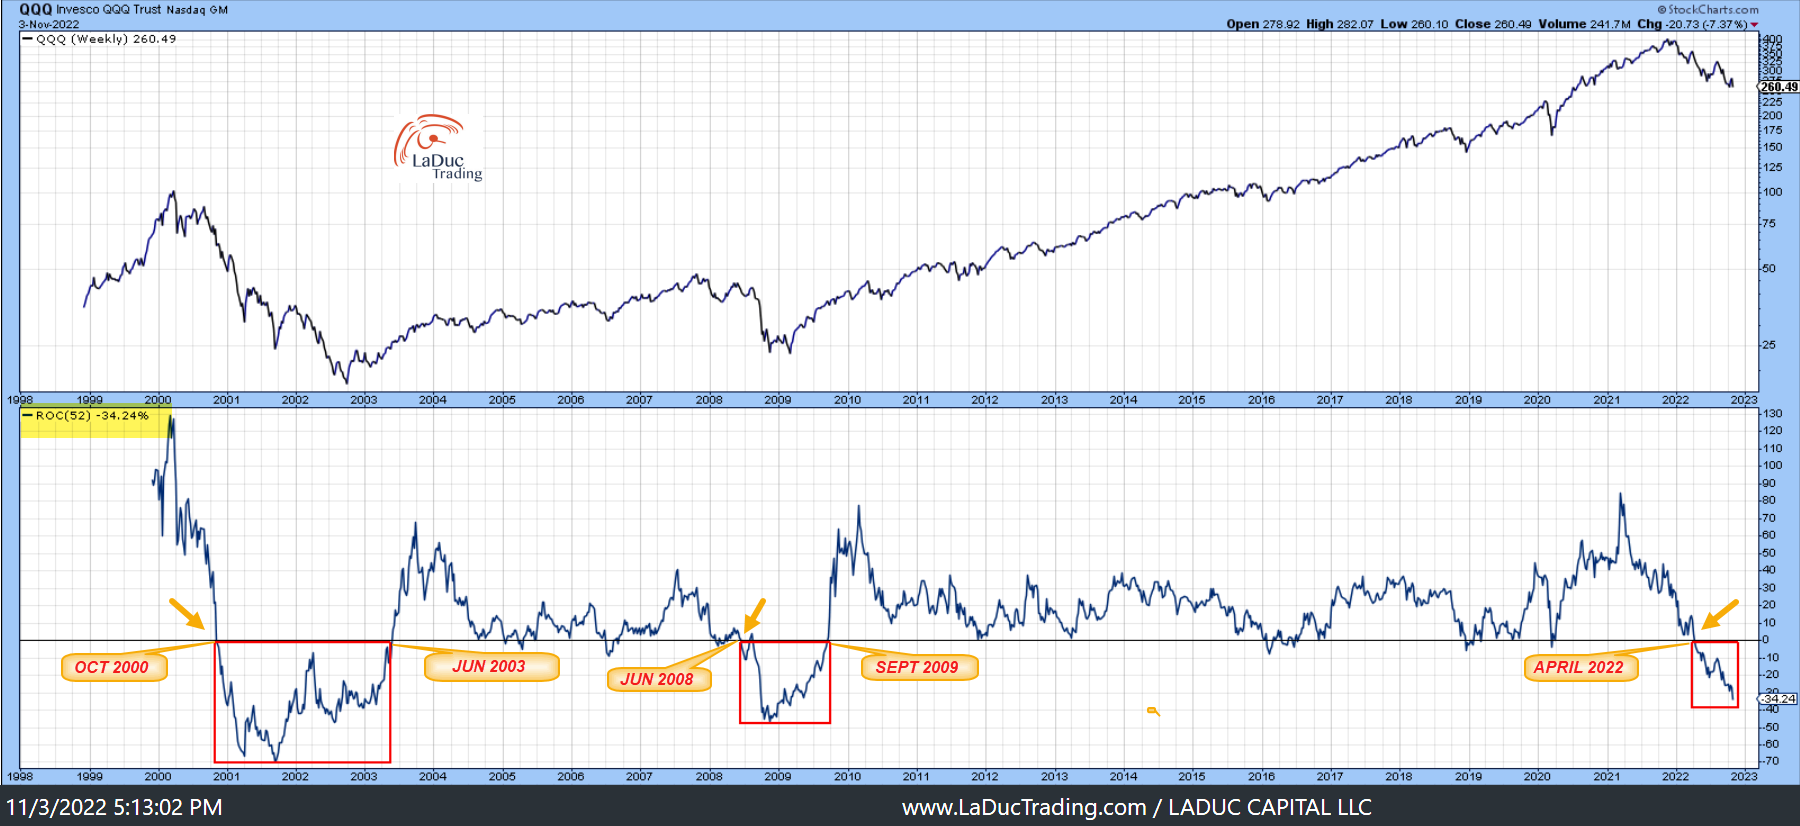
That was my cheeky way of warning not to chase. As clients know, I study closely “Rate of Change” (ROC) indicators as a means to spy momentum thrusts (velocity) to the upside as well as down, which can confirm not only directional trends but duration.
My multi-decade chart of QQQ with ROC in the bottom panel supports my main theme that tech selling isn’t done.
As you can see from 2000 period, Nasdaq fell another 74% from where my indicator crossed down in October 2000. Of course this time will be different, and so is the backdrop of 40 year high inflation that has proven to be anything but transient. Now add the backdrop of a determined (some would say behind-the-curve turned aggressive) Fed in a tightening and rate hiking regime, and it becomes clear market is still not safe. And this is after oil was cut in half since March 2022 highs.
Nasdaq is in a Major Bear Market and will continue to underperform until it has climbed back into neutral-to-bullish territory as shown by my ROC indicator above 0.
Until then, and that looks to be awhile, Tech is not safe.