Recall the 1% Risk Parity Trade of March? I wrote about it here:
Gone Fishing Newsletter: The 1% Outlier Event That Tanked Equities 30% – Mar 24, 2020
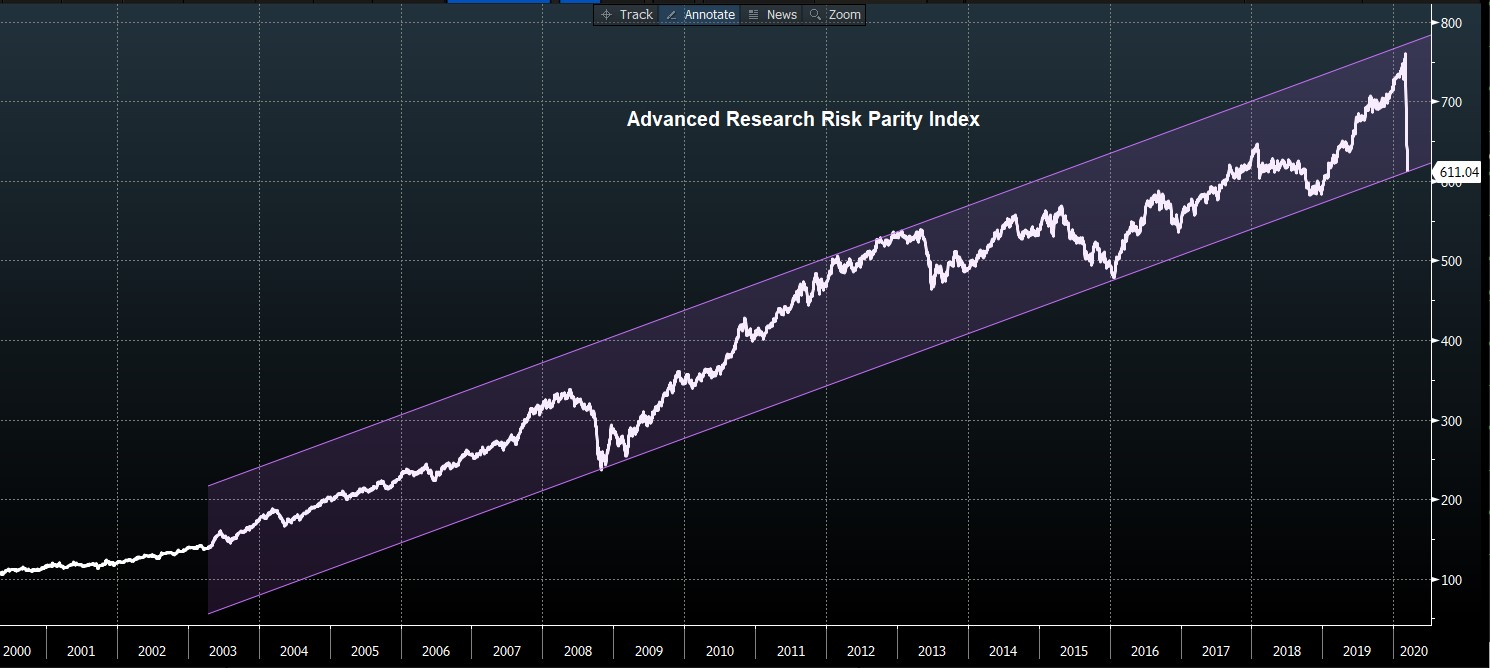
Back on March 18th, the S&P 500 was down 16% in 7 days while 10-year yields more than doubled. Some risk parity funds were already down 40+% in a month.
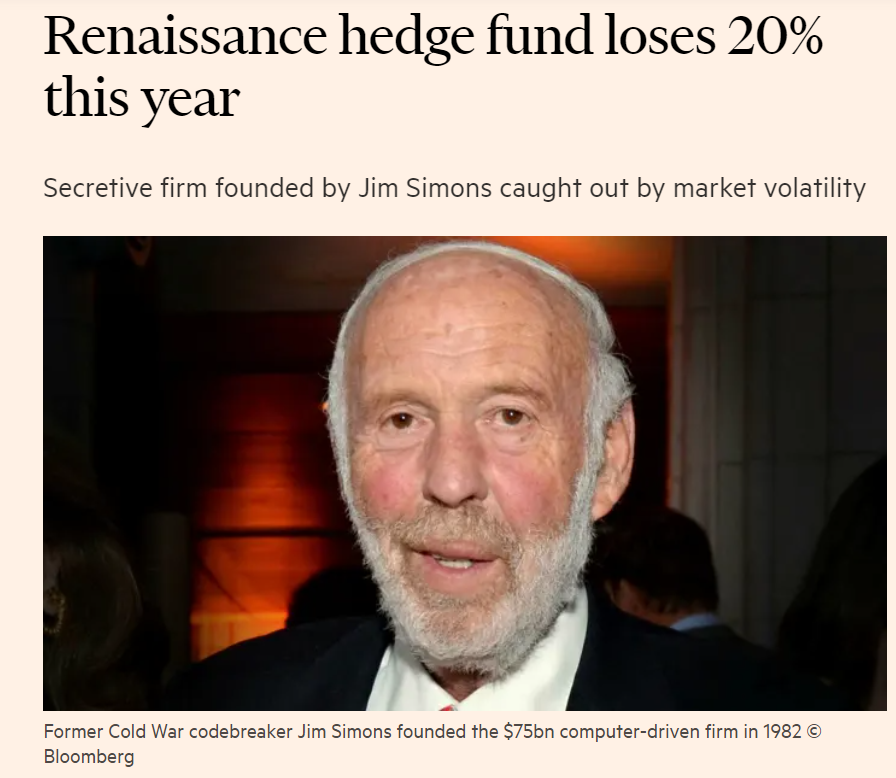
Renaissance, one of the most successful computerized hedgefunds, specializing in ‘market-neutral’ portfolio construction, announced they are down 20% this year. They are no doubt one of many negatively affected by the Risk Parity unwind. There were others of course, more meaningful to market structure like Citadel, Millennial, and rumored Bridgewater.
This news prompted me to assemble some sources and insights to help clients better understand Risk Parity, Market Gamma and how ‘Option-Driven Equity Flows’ help inform my market timing calls!
Risk Parity Matters
Basically, Risk Parity is the core of the Modern Portfolio Theory: bonds act as a hedge to stocks. When that correlation stops working, portfolios have no hedge and have to go to cash.
Why does that matter?
“the OTC derivatives world could be about $25 trillion short on margin”
Well, suppressing Volatility – a popular quant/hedge fund strategy – allows risk parity and volatility target strategies to increase their trading exposure materially…and in turn, the unwind can exacerbate selling.
That is one way I timed the historic January 31st 2018 sell off that resulted in the massive unwind in XIV on February 5th, which resulted in its obsolescence – and a doubling of my account in two weeks.
It was a “simple” 4% intraday $SPX move that caused the volatility explosion leading to the 2/5/18 Volmagedan. My Tell: Prior to this both stocks + bonds sold off together (negative correlation) forcing risk parity funds to sell.
It wasn’t Macro Events; it was Market Structure. Fears of the following were backdrop:
- US-China Trade War escalation (which is now threats of US-China Capital Markets War escalation)
- China selling US treasuries, or Saudis selling US treasuries, etc
- Rates moving higher
- US Pension Fund Rebalancing
- we can add COVID to the list now
Point is: Risk Parity matters to market structure, so here is an excellent thread and presentation that I highly recommend to better understand how risky and market-moving this construct of a vehicle this can be:
Excellent thread to explain those short vol/gamma strategies that highly levered hedge funds are still digging out of! $VIX#RiskParity https://t.co/Wvgp7jbO7Z
— Samantha LaDuc (@SamanthaLaDuc) March 24, 2020
Market Gamma Matters
Start here:
All You Ever Wanted To Know About Gamma, Op-Ex, And Option-Driven Equity Flows
In my study of market gamma last two years, I have found that it can be a powerful timing signal to alert to potential trend changes. As clients know, I use a wide spectrum of indicators from macro to micro to get my ‘market feel’. Market Gamma is but one of them, but I thought it useful to share where I see its strengths – in helping to predict sell-offs not bottoms. Because “positive gamma” is effective at marking a change from high to low volatility, it is not a great tool for marking significant bottoms in markets.
“Gamma has the potential to be one of the most important non-fundamental flows in equity markets (particularly when “short gamma” causes volatility to accelerate), but tracking gamma is complex and dynamic.” Goldman’s “greeksplainer” on Gamma and option-driven equity flows.
Why US equity index gamma matters more than it use to:
- Option market is growing: Option open interest has averaged 20% of the SPX market cap over the last six months
- Demands for liquidity have grown: Delta-hedging of options demand instant liquidity in response to market price moves so investors likely to cut risk when volatility rises.
- Liquidity itself has weakened, particularly at the end of each trading day. Gamma-driven flows move markets especially end of day because some delta-hedgers focus their hedging at the close (e.g. to match variance swap payouts).
So as you can hopefully see from this informative article, option positioning by dealers, i.e. gamma, moves markets. And knowing this can help position for it. That’s why I study it.
How does gamma connect the March 2020, February 2018, and October 1987 volatility events?
Each of these events (among many others) was an example of a mismatch between investment strategies demanding near-instantaneous liquidity and markets not being able to supply that liquidity. In each, simply the sharp fall in equity prices caused selling of equities that potentially exacerbated volatility. In March, the dislocation between close-to-close realized volatility and volatility measured from prices collected at other times of day indicates likely short gamma-like activity creating impactful end-of-day flows. In the VIX spike of February 2018, VIX futures rising pushed more buying of VIX futures, a short gamma-like feedback loop. In the 1987 crash, portfolio insurance strategies sold equities in response to equities falling, also creating a short gamma-like self-reinforcing loop in markets.
Option-Driven Equity Flows Matters
I follow several quant analysts who study Option-Driven Equity Flows. I want to share with you an excerpt of a report I got Friday morning from Brent @spotgamma. I hope it will help you see how I use this ‘gamma’ and option-driven equity flow to better time market direction in combination with my other reads. It is but one tool in my toolbox but I find it helpful to compare with all of my pattern recognition senses, internal indicators and intermarket analysis.
SpotGamma’s note followed the big 5 standard deviation move Thursday in SPX… (bolded/colored emphasis mine):
Markets are staging a rally this morning with futures around 3050. 3000 now comes up as the major support level and largest gamma area. Surprisingly there wasn’t much movement in the zero gamma/vol trigger strikes, with ~3065 showing as the flip zone. Probably the most interesting metric out of yesterdays move was this Delta Tilt chart. Through numerous backtests I couldn’t pull a reliable indicator from this, but these sharp changes can presage large moves. This suggests to me that negative deltas picked up in force and this *could* infer dealers have more selling to do.
To this point we had originally been marking next week and OPEX as a turning point due to the removal of record levels of equity calls, but now those positions have been demolished. This may have capped some of the “ex-SPX” negative gamma that was in markets. A big part of what I believe led to March volatility was March puts that were pushed deep in the money following the sharp end of February decline. Because of this move lower we could see some reshuffling of the deck ahead of the June OPEX and that may therefore reduce some of the volatility “potential”. We will be watching this data closely into next week.
For today 3000 is key support, and we note the put wall just below at 2980. If this area goes in the money it suggests a large amount of put hedging from dealers and a potential larger spike in volatility. 3100 shows as resistance for a move higher. Watching VIX may be key today, if it trends lower that suggest puts are being closed and that may fuel a move higher as dealers buy back hedges. Obviously higher VIX suggests increased dealer shorting. Keep in mind that because we may open in negative gamma territory “support” levels are a bit more tenuous.
As clients know, I also use intraday reads such as VIX, ZIV, cumulative volume, etc not to mention chart pattern recognition on SPX, NYSE across assets (rates, commodities, sectors, etc). Suffice it to say, I value money flow and option data is both a sentiment read as well as investment positioning read that helps me spot tail risk. I will continue to spy rotation from this data when used IN CONTEXT, as that is what truly helps me make my prescient market timing calls.
Right now, I interpreted Brent’s ‘Delta Tilt’ as short-term bullish with risk of another Rick Parity-inspired event potentially picking up speed at quarter end. Quarterly option expiration weeks have historically had 10-20% more SPX option trading volume than other weeks. And as we saw last quarter, being on the wrong-side of the option flow can be very dangerous to risk-on speculators and very profitable to those positioned for risk-off. 