Table of Contents
Macro Market Thoughts
I was pulling together my weekly review of intermarket charts for you when it occurred to me that I should be seeing a stronger bullish set up given the liquidity going into the markets the world over: Japan, China, Eurozone, United States. ALL CENTRAL BANKS ARE EASING AND DOING QE. So with that, where’s the panic buying in indices?
We had peak global liquidity back in Aug 2018 – before 10-year yields peaked October 3, 2018 and set off not only a crash in equities but in yields themselves! Fast forward, and we have three rate cuts from our Fed and world Central Banks are back to ‘pumping up markets’ with coordinated liquidity infusions. Curious: all three major banks of FED, ECB and BOJ are adding liquidity – at the same time! They have taken turns before…
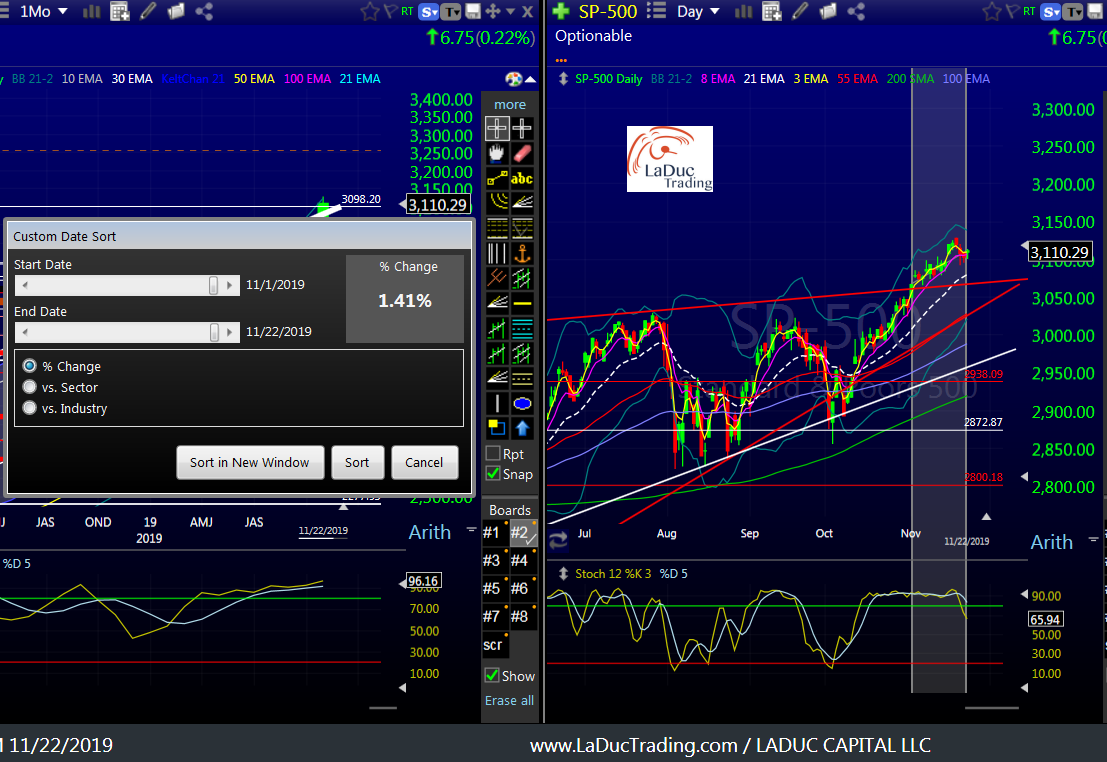
Markets are supportive but not spectacular. The expression that comes to mind is “Diminishing Returns”. Under ‘normal’ circumstances of Fed cuts and Quantitative Easing (2009, 2010, 2011, 2013, 2015-2018 from ECB, and now Fed Repos in 2019-2020…), market should be deliriously happy. I would expect a better response to the “Fed, ECB, BOJ, CCP put”. But we are only up 1.41% this month since breaking above an important trend-line.
Bulls are happy and Bears are frustrated. Fed started moving from QT to QE (from this summer’s July 31st FOMC rate cut decision, removal of balance sheet normalization to Repo in September), and yet markets have chopped around in large part – only to have recently broken higher. But markets haven’t run higher breathlessly. What’s the hold-up? Could it be the fear of recession, or the contractionary affects of Trump’s Trade War, deglobalization, isolationism? Maybe folks are deep-down worried about Presidential impeachment at best or an anti-stock buyback 2020 POTUS at worst?
Regardless, the market isn’t going down so most must assume that very stimulative fiscal policy with very stimulative monetary policy will jump-start the economic growth engine.
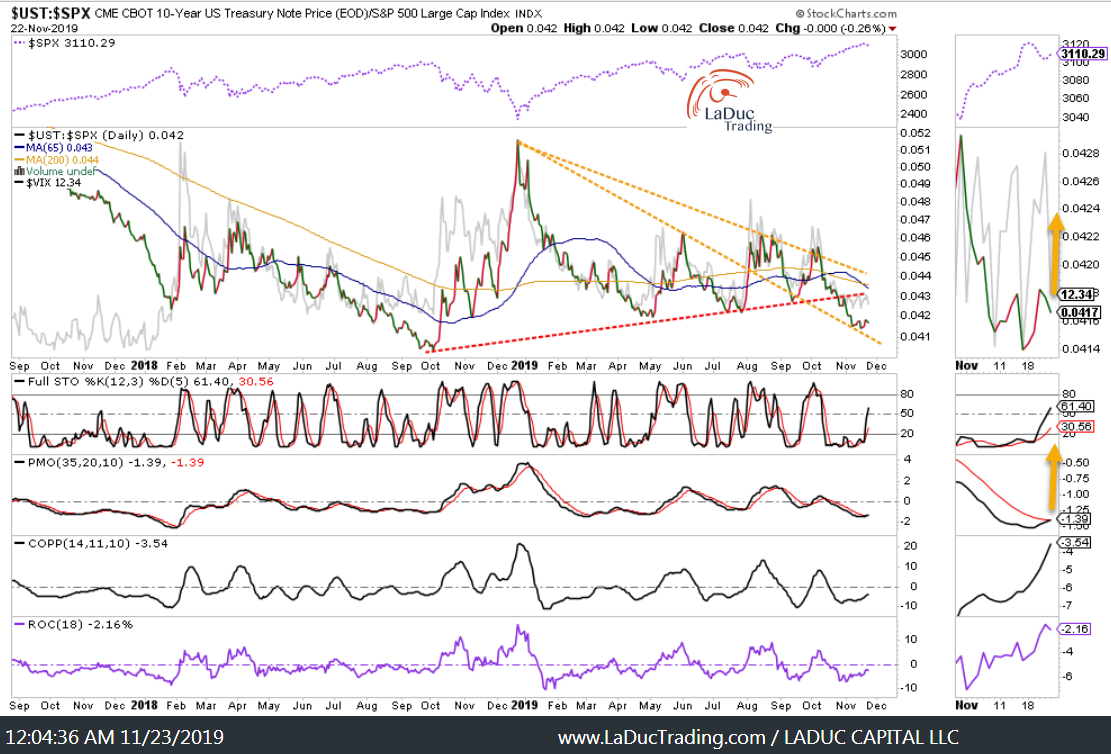
But Bonds are not excited about this. Maybe because they know this combined effort can more likely jump-start inflation – and around the world at that.
We already know that increasing budget deficits are inflationary. Bond markets certainly know this as nothing will kill the bond bubble faster than inflation.
So with that, I’m watching for the following themes to emerge in time should equities finally catch on that rates are going higher and with that the inconvenient truth around having to service their debts. But first, there is no reason to panic until the following kicks in:
- yield curve once again starts to steepen
- bonds sell-off aggressively again
- rotation into foreign markets from US equity flows
- rotation into value stocks over growth stocks
- eventually, a weaker US dollar
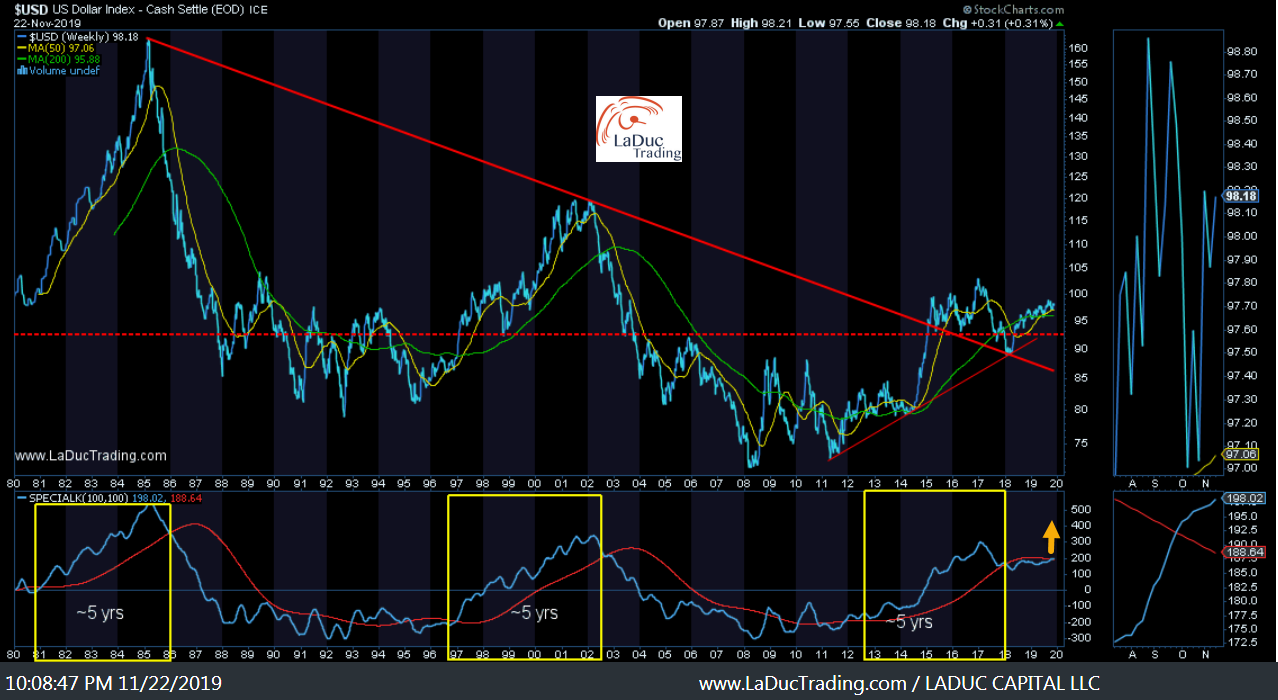
But right now, USD continues to move higher, albeit slowly. Higher USD is defacto tightening. So…also hard to rally hard with that as backdrop.
Sector Themes
Bonds and Gold
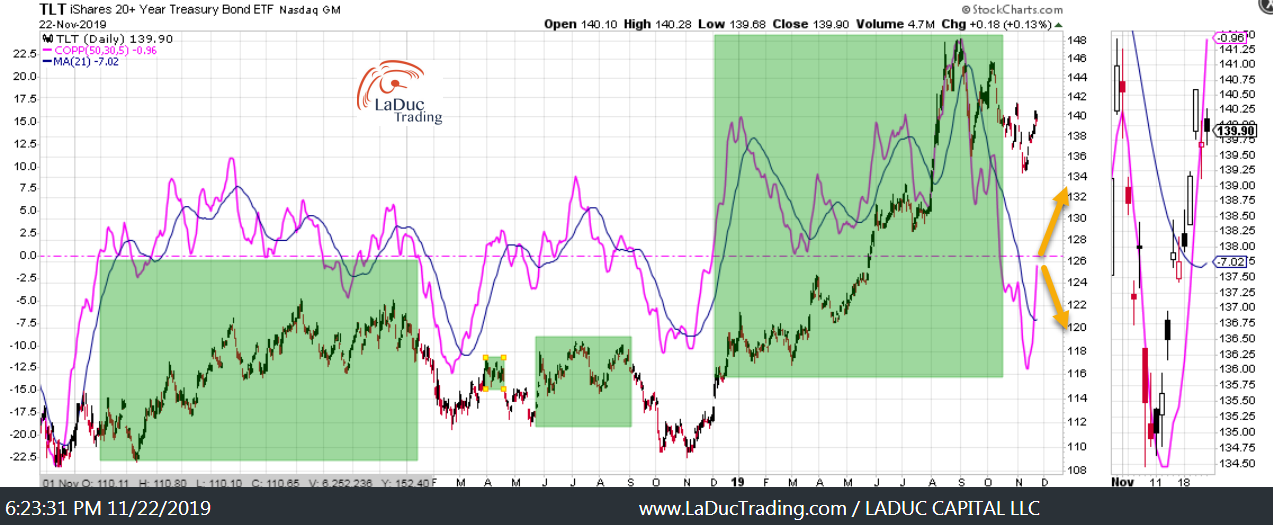
After reading the above bond thinking, you will soon figure out that I think I shorted TLT early…

And with that the 10-year yield probably has a lower number to hit before bouncing:

Here’s an intermarket read using Coppuck Curve – a useful indicator among several I like to help foretell direction. And with that, I will know very soon whether bonds can get above the pink zero line (bullish) or get rejected (bearish). I am expecting rejection – think mini bear bond market.
And same thing for Gold: lower with bonds.

IPOs
I see no reason why this idea past week plus would be over – IPOs: Market Thoughts: IPOs As Value Plays
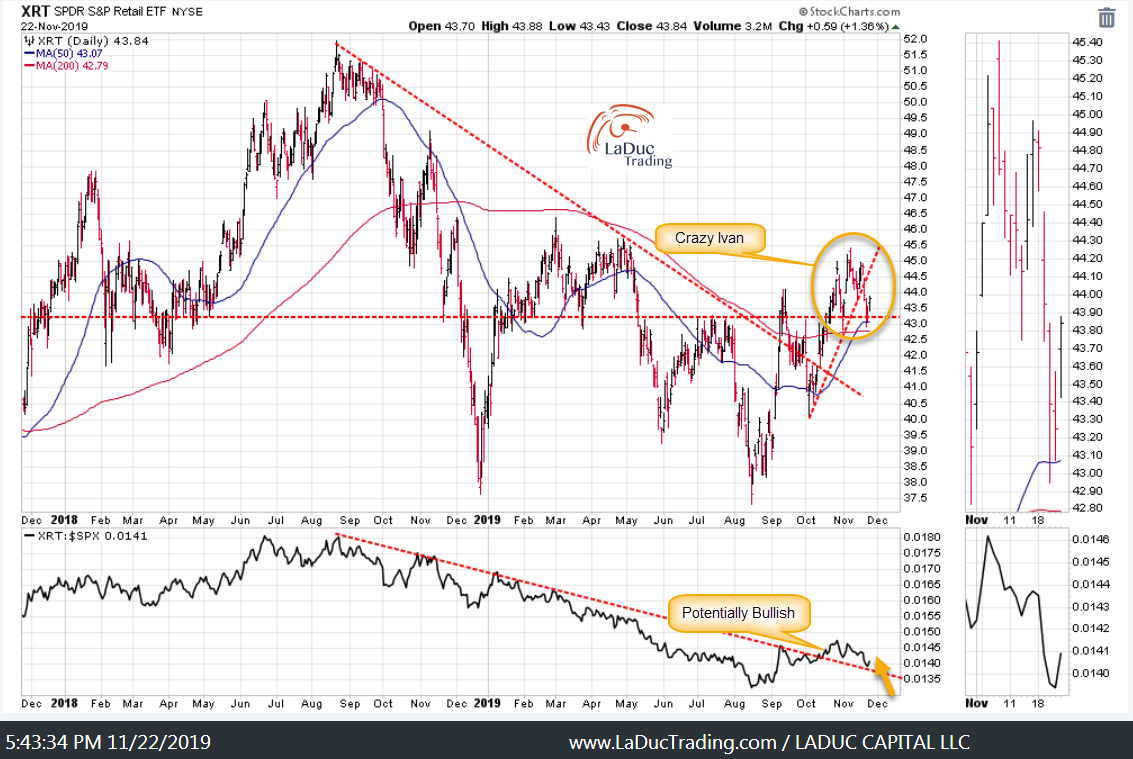
Retail:
I have still not given up on RETAIL!!! I just got in too early and didn’t hold well through the chop.
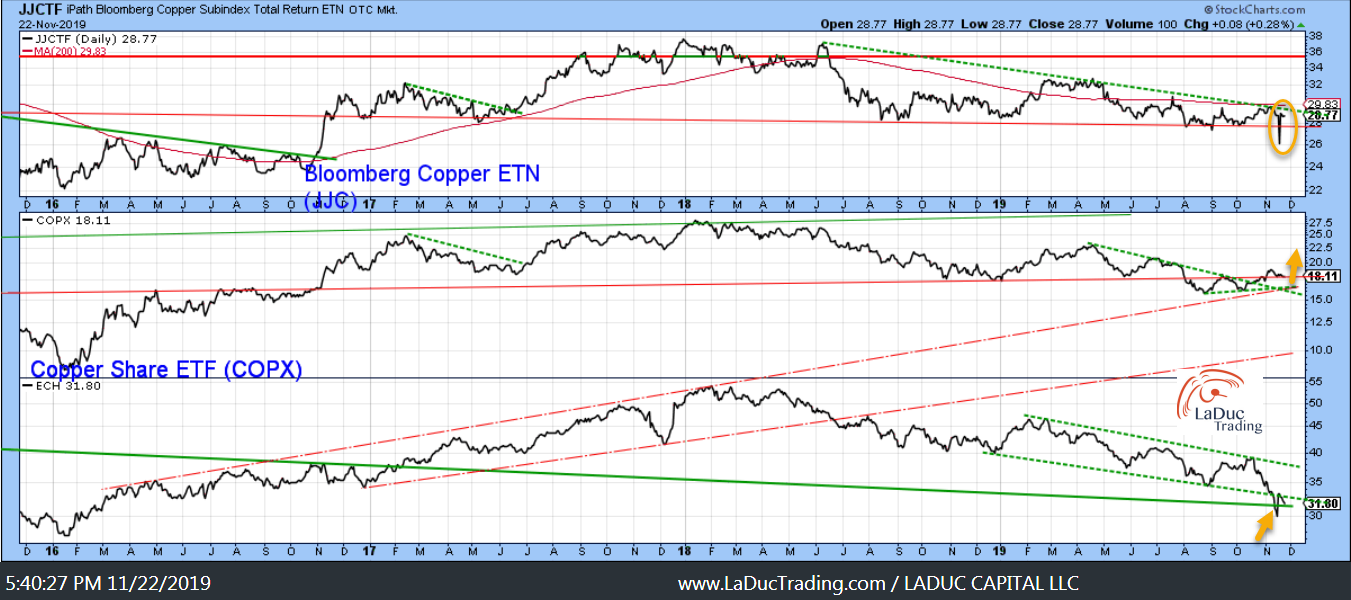
Reflation:
Another Sector that proved choppy was/is XME, but this chart of Copper looks very constructive. Think: FCX. Given my Reflation theme, this one could just start to be forming:
Volatility
My thesis is still that we start a market pullback in Q4 that lasts several months. For next week – a holiday shortened week with reduced trading volumes, all time VIX shorts and six weeks of very tight intraday ranges – it wouldn’t surprise me to see Volatility perk up.
Again, where’s the panic buying?
SPY hasn’t had a daily drop of more than 0.4% in six weeks. In 10 of the last 13 days, the SPY has closed, up or down, by less than 0.28%. I realize there is a relentless bid to buy any dip in the market, but that also creates a situation of “first in, first out” should markets reverse and bulls turn around and stampede out of the corral.
Economic Data Red Flag
Thursday we saw a jump in the jobless claims number – although this Monthly chart of unemployment claims only shows most recent data as of last week not this week. Point is: these prints are not going down. At the same time, my chart read says jobless claims are very close to becoming a trend reversal higher above the pink 24M moving average which translates into lower market prices.

The U.S. stock market will be closed on Thursday for Thanksgiving, and it will close at 1 p.m. on Friday, November 29. Trading Room will be open every trading day!