What we have witnessed in markets of late is a once-in-a-lifetime event: a 1% outlier event in risk-parity de-risking that slammed hedge funds Ronin, BlueCrest,Citadel, Millennium, and ExodusPoint to breaking points, caused some Fixed Income funds to restrict redemptions and helped to trigger, to date, a 32% pullback in SPY.
This Value at Risk (VAR) chart is from 10 days ago, but it does a very good job of graphical representing the Risk Parity unwind outlier event.
We will not go into all the limitations of using VaR as a risk management model, but it is fair to say that most big banks and institutions use it to measure risk. One “little” problem with the model is that most traders and PMs using it do not understand the model and are “lulled” into a false sensation of being “safe”. They tend to forget the 1% probability they do not “measure”, and this is exactly what has happened this week. You as a trader or trading firm simply do not know your worst case with looking at the VaR only. People us VaR, do not understand it and above all do not use additional methods to consider that 1% event, that occurs every now and then. Below is probably the best chart explaining what has happened this week, risk parity strategies “discovering” the 1% event…. BMO
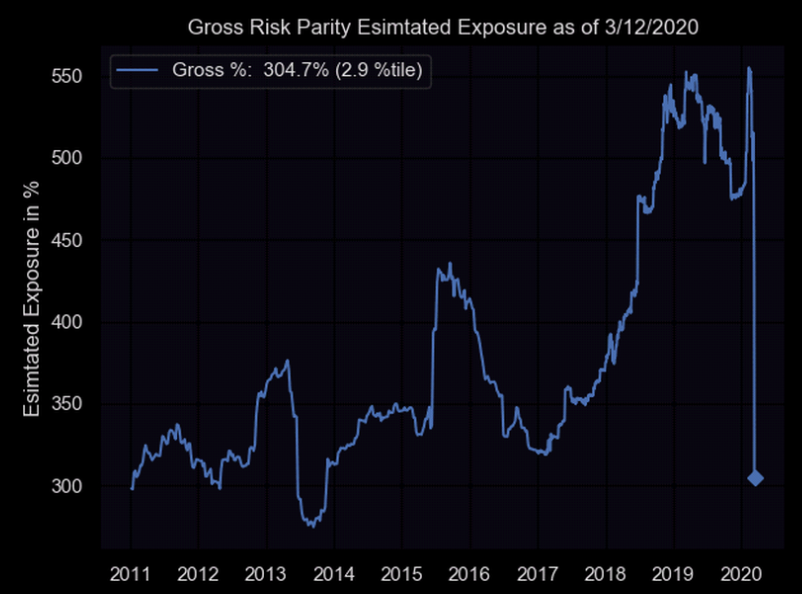
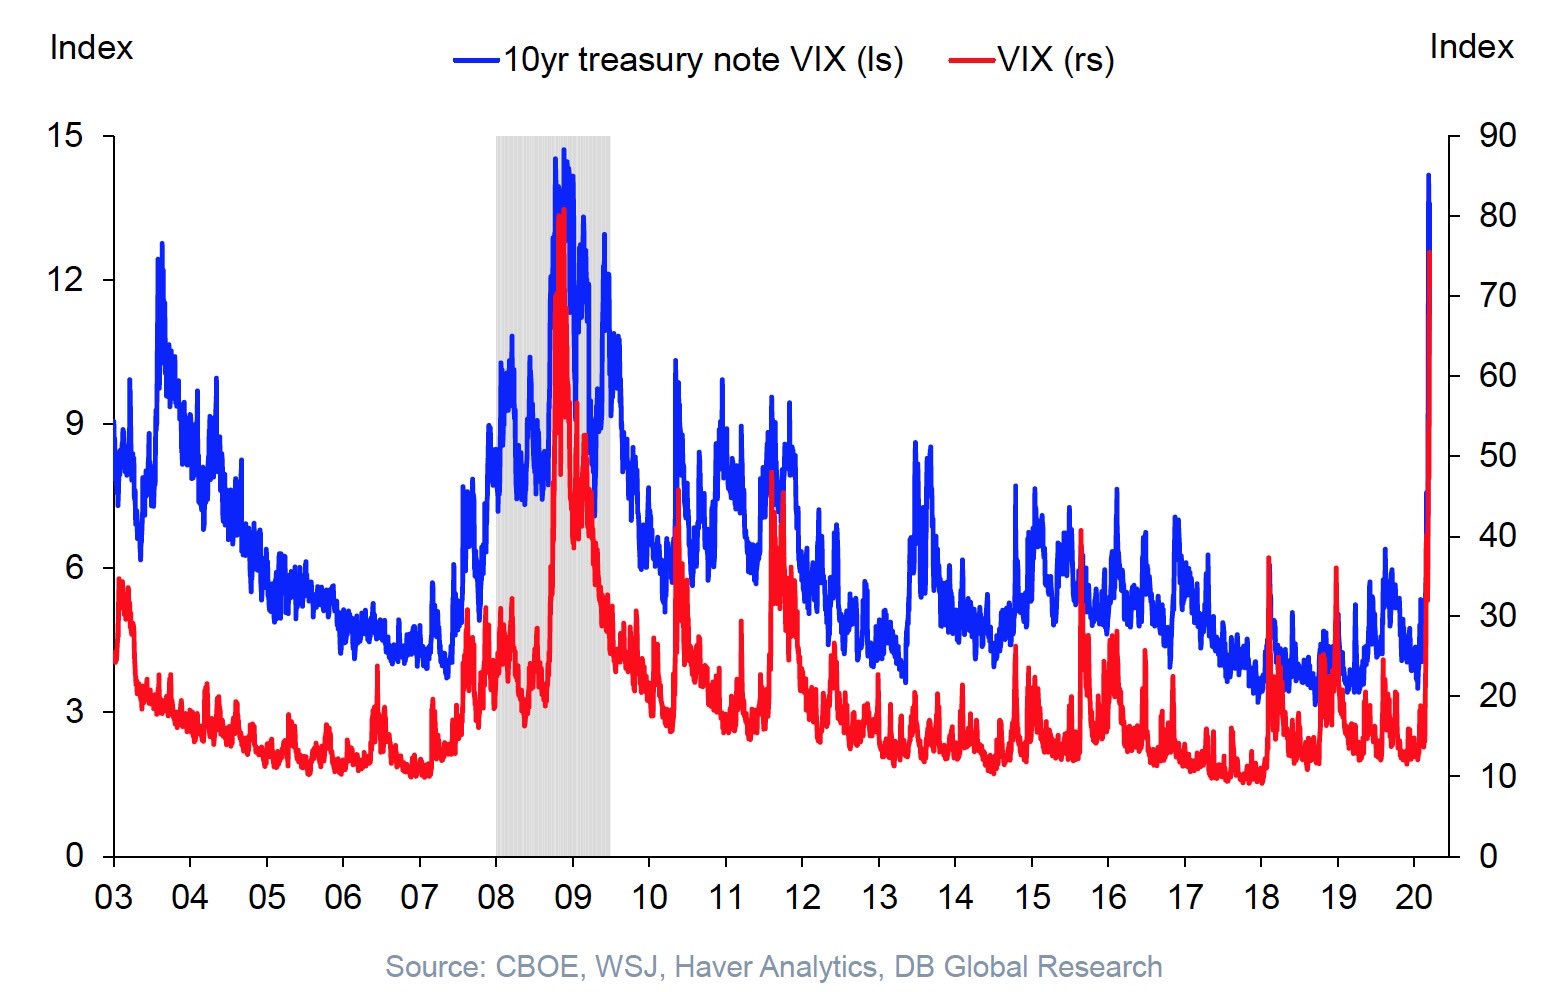
The risk-parity computer traded model caused the dumping of stock and bond positions to go down together March 10-18th, as both rotated to cash. Through it all, volatility rose steadily and higher than the 2008 crisis while I predicted and warned clients every day in my live trading room how much further this could go.
The following “Risk Parity Index chart is from March 18th. On this day, the S&P 500 was down 16% in 7 days while 10-year yields more than doubled. I suggested the Fed would absorb the supply of Treasury sales, causing yields to once again fall but that either way, it would be bad for equities. The 10-yr yield dropped from 1.26% to .76 since that March 18th call.
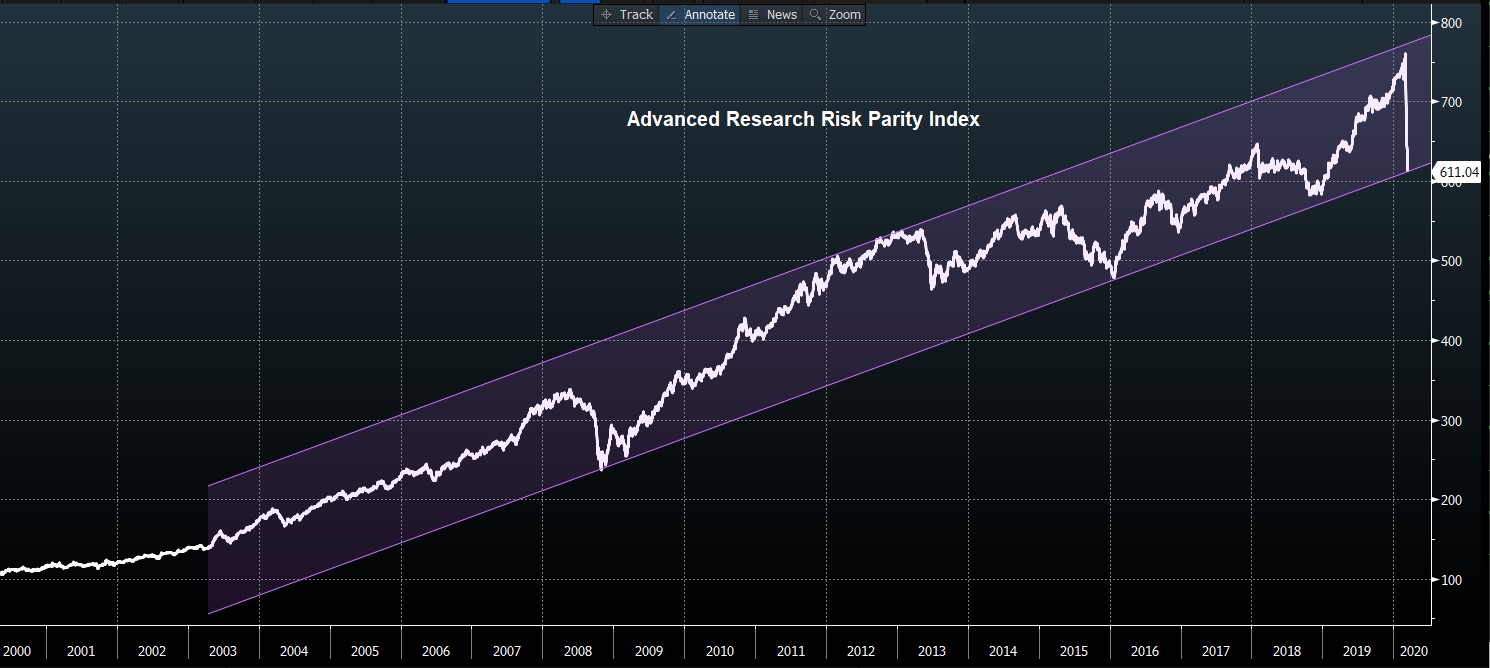
I contend this line will be broken as leveraged funds of all types continue to de-risk – potentially at a slower rate, but this “de-risking, de-grossing, de-leveraging” is not over as long as the USD is in escape velocity mode.
Here’s why: Low-interest rates, Quantitative Easing, Fiscal stimulus and other emergency monetary measures that are being implemented right now are highly deflationary with a stated purpose to ‘break the back’ of the dollar bulls and eurodollar spike. They better hurry…
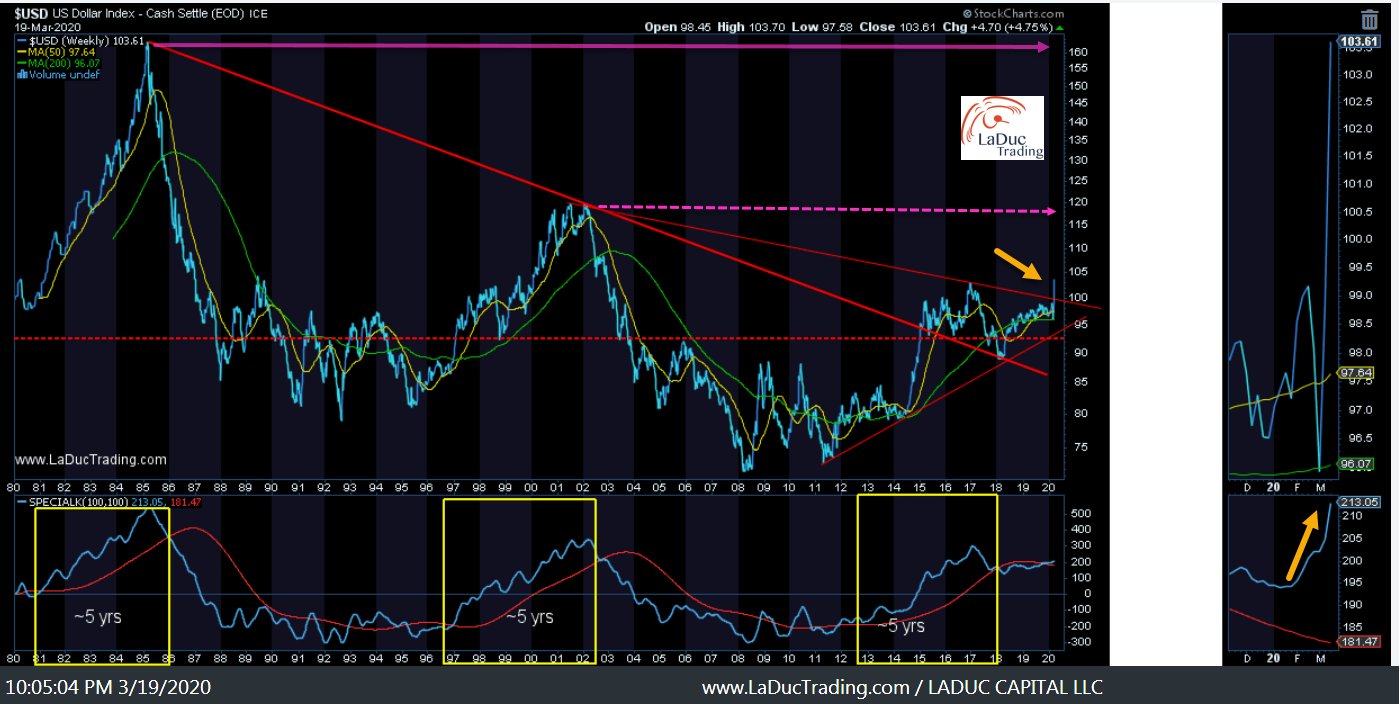
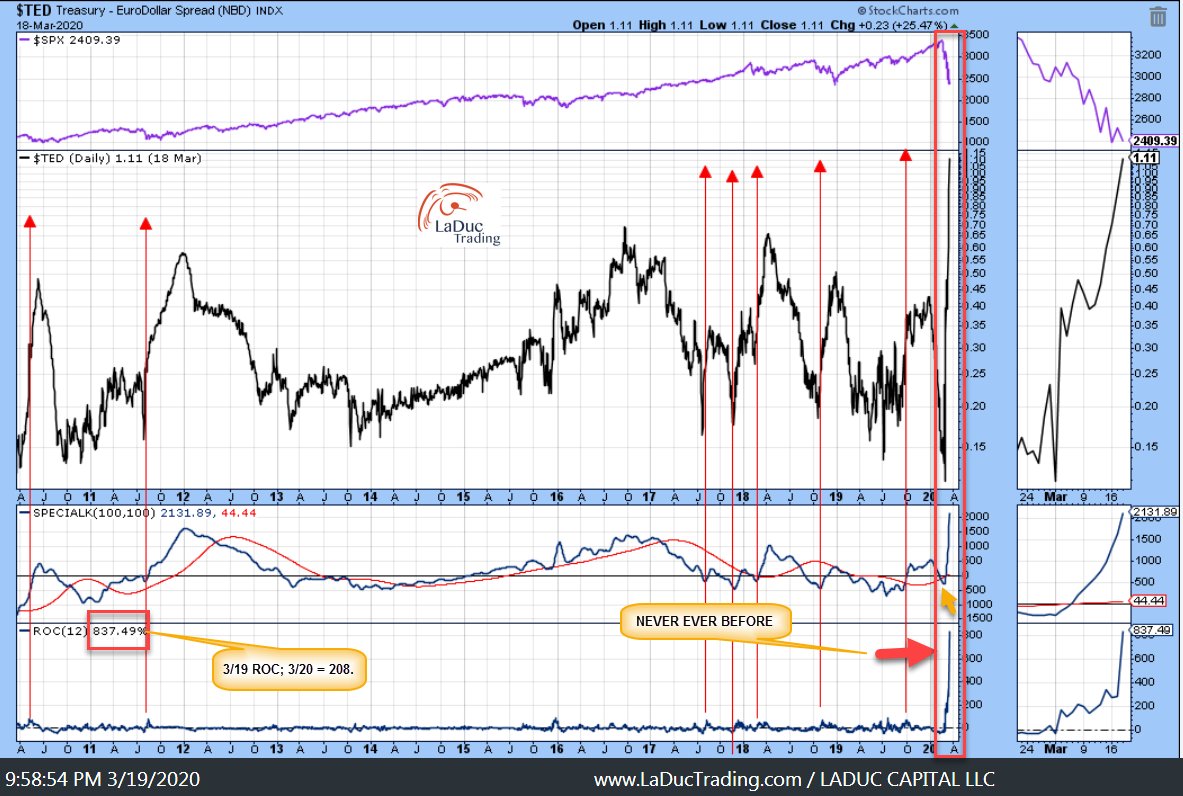
The rate of change for the TED spread hit a NEVER BEFORE record at 837%. Back in 2008, it took the Fed about 6 weeks to break the TED spike with currency swaps and QE. With that, the next phase of stock sell-off likely begins when the USD spikes hard.
This is why the Fed must continue to buy an unlimited amount of U.S. Treasury securities – and is buying the largest amount of Treasury Bills, Notes and Bonds at its fastest pace in history. Bond redemptions are at unprecedented levels which is why the Fed is adding to their balance sheet daily.
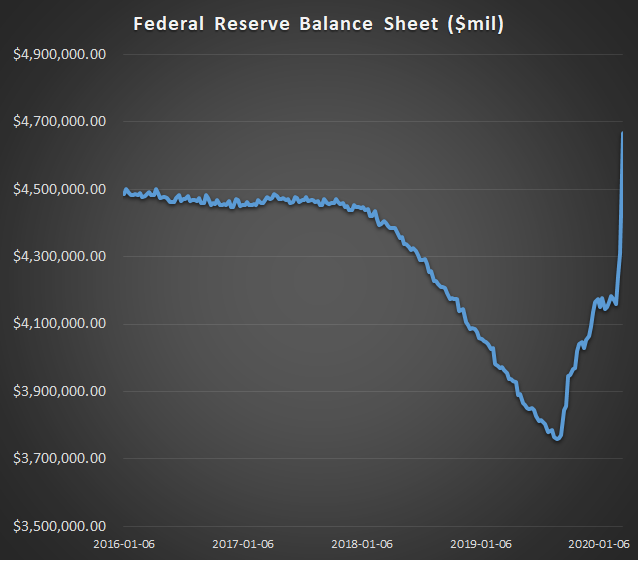
As of March 18th, the Fed’s balance sheet soared $356 billion in one week. They then added $150 billion in UST and $30-$40 billion in MBS purchases on Thurs/Fri. All the while bonds sold off.
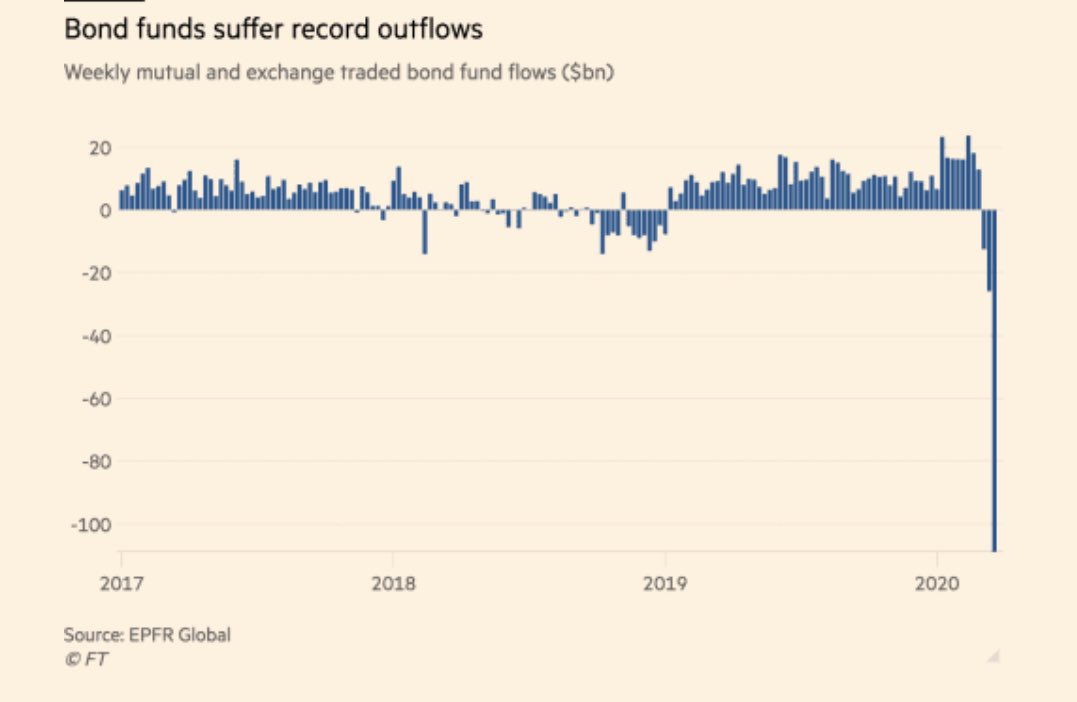
A record week….
$55.3B outflow of IG
$18.8B outflow of EM debt
$5.2B outflow of MBS
$11.1B outflow of municipal bonds
$3.6B outflow of TIPs
$2.5B outflow from gold
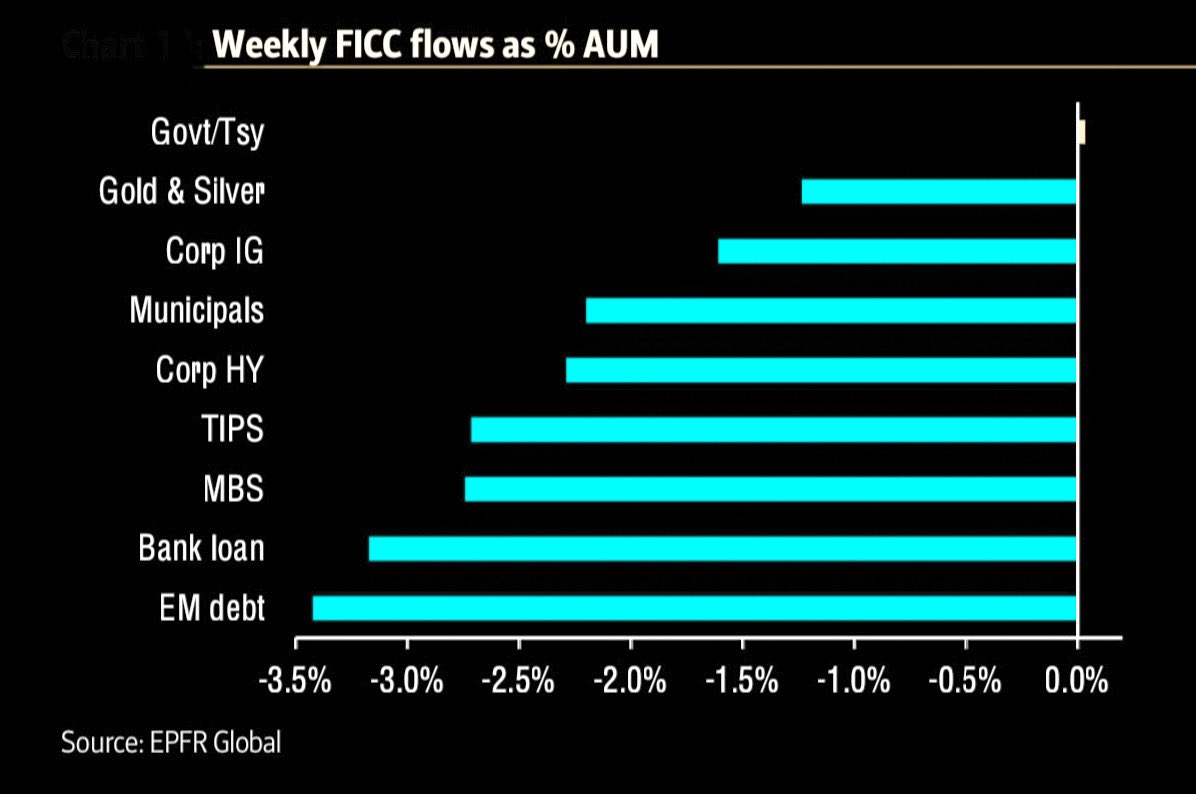
And why Treasury Volatility exploded.
Next, Fed may be called upon to help Pension funds…
The exit door for bonds is scary small, as explained in one of my fave RealVision Interviews ever.
Fed caused the Stock Market Bubble by suppressing yields so that Central Banks around the world had to join in. Now Banks, Corporations, Politicians, Hedge Funds, Pension Funds, Fixed Income funds, Credit Agencies, Private Equity and Passive Indexing have become dependent and all face deleveraging at the same time!
And that’s ultimately why the Fed will continue to print from thin air an unlimited amount of money to buy Treasuries to absorb the selling which will keep bond prices bid and bond yields ‘capped’. But this entire action on top of the economic effect from COVID19 is extremely deflationary, and with each passing week, it will be more deflationary as businesses and schools are forced to close creating both demand destruction and supply disruption. Many Americans have no choice but to stay home and a good number of them have no access to unemployment insurance or healthcare. When consumers and businesses don’t qualify to borrow, the deep recession will worsen as the spike in unemployment rate and default risk threatens depression – both economically and emotionally.
Aside from the Risk Parity Unwind and dash for CASH triggering redemptions the world over, it seems obvious that Treasury yields will continue to fall and with it bond prices rise. Equities will continue to fall with yields. Once yields bottom out, stock prices should also be bottoming, but I don’t expect that to occur until end of this year at a minimum.
“Value” trades have been left for dead as risk-parity traders bought Tech and shorted Energy, Commodities, Agriculture etc.. When the Fed is finally able to stop the dollar from rallying, Commodities should do well, along with Gold.