Big Picture: We are still in a bear market. And as I suggested in late March, I see a multi-month process of digesting the out-sized downdraft in Feb/March, which includes both large rallies and failures. We have only seen the April bear market rally. But as we enter May, the famous adage, “Sell in May”, comes to mind. And here’s why:
My Stock-Bond-Volatility ratio read (ratio moves inversely to SPX) just tagged the 65D last Thursday and bounced. It helped me time the Friday pullback last week. Granted, Monday the gap down was bought – as most Monday gaps have been bought – but there is a range within the channel (see dotted red lines and red highlighted boxes) where this ratio is likely to move. Above .05 is most definitely Risk-Off; below the 65D is Risk-On… (purple circle) at least to the 200D (.045). It would not surprise me either way but my leaning is May pullback then snake-like June bounce.
(A reminder that this was one of my Top Tells for me to spy the Feb/March pullback and VIX explosion. It has only reverted to the mean, and since the ratio is still above the 200D (this ratio’s 200D not SPX), markets are still at elevated risk .)

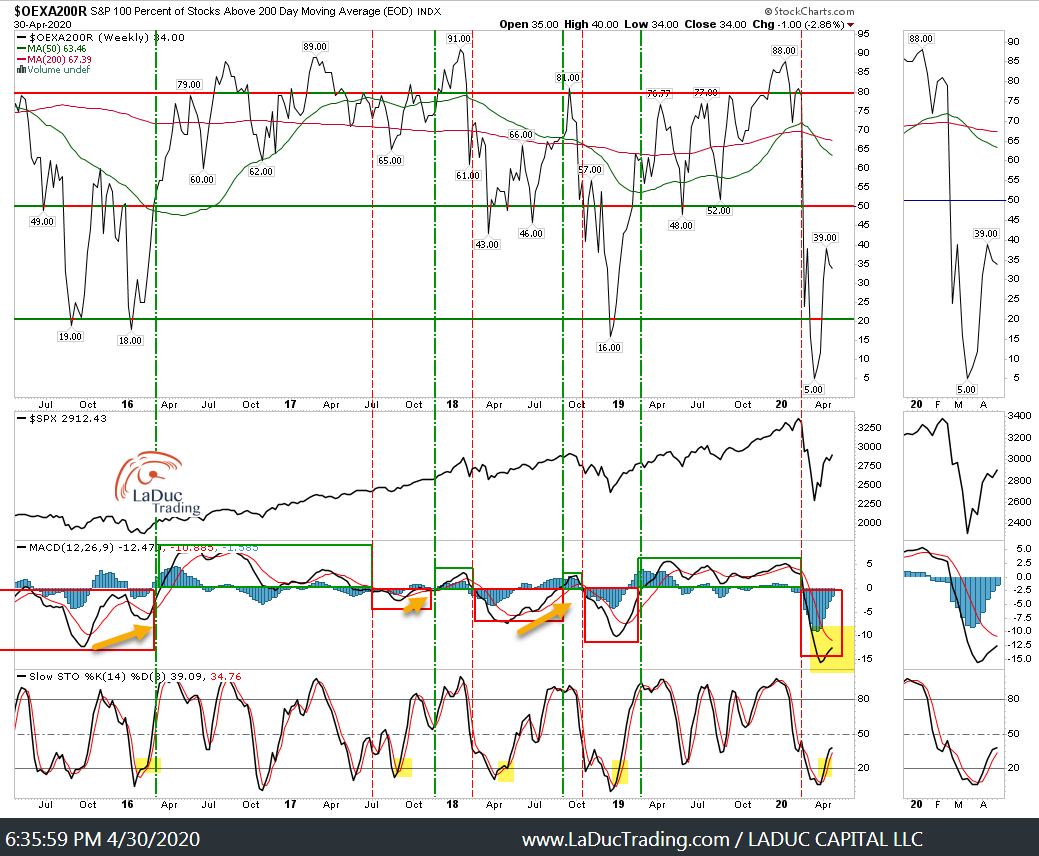
S&P100 stocks registering above their 200D looks like A LOT of my intermarket weekly reads – still not behaving or believing this rally off the March 23rd lows. A retest of lows looks much more likely the longer MACD takes to turn and cross these indicators up and out of negative (yellow highlighted area).
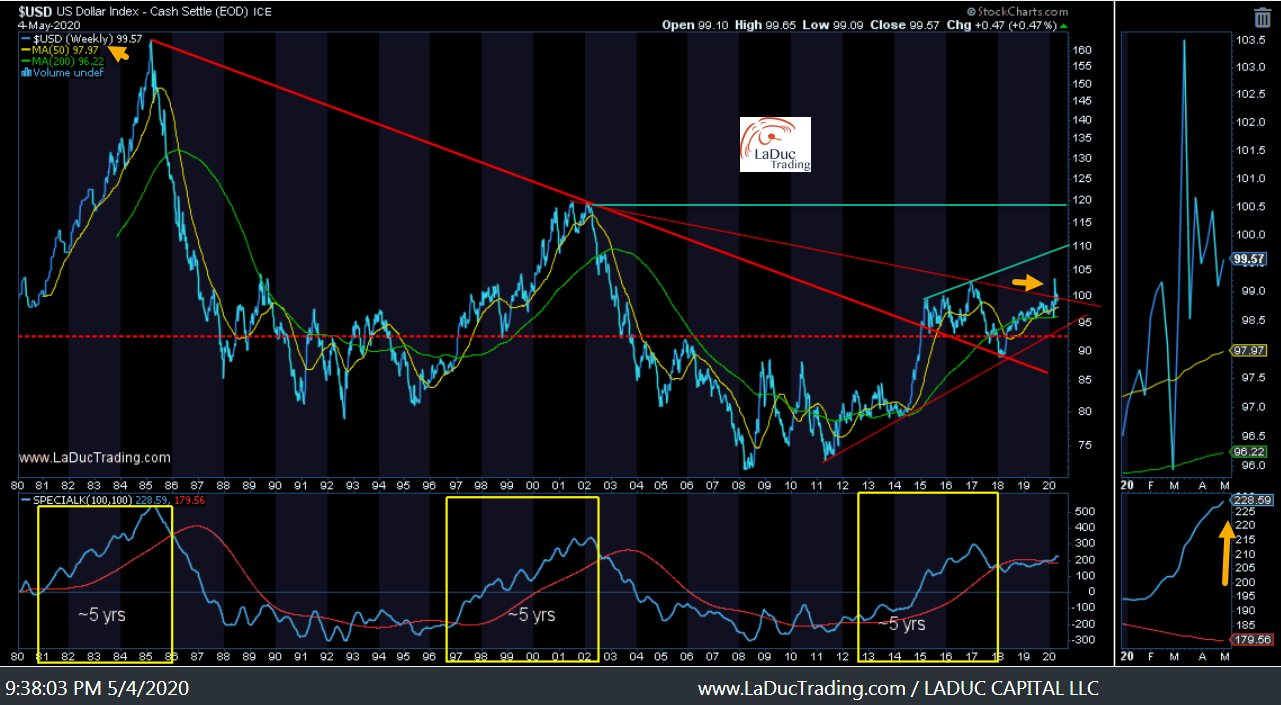
The US Dollar makes the weather and this March break-out has since been pushed back down after Fed intervention and $8.5 Trillion in disaster relief efforts by Fed, Treasury and Congress. I still contend, this chart looks bullish. Further, the macro backdrop of US Dollar liquidity shortage is a real problem and other currencies like Euro look very bearish.
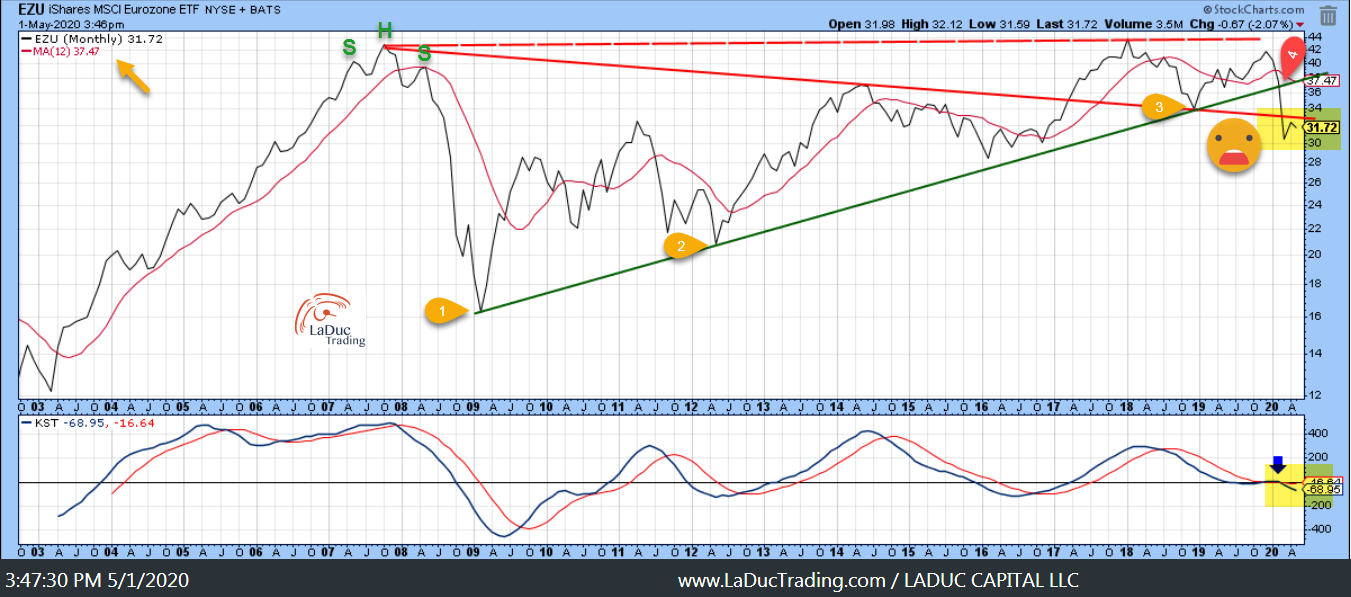
Speaking of the Euro, the Eurozone has broken down, retested and is now in a critical juncture:
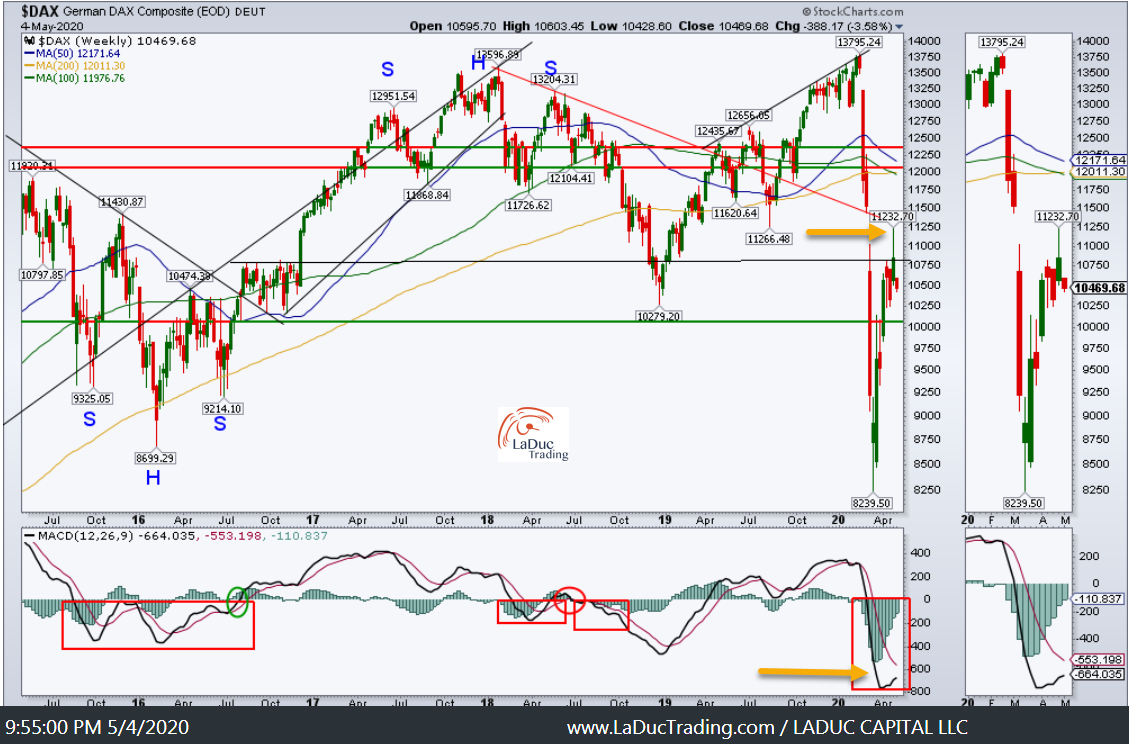
German DAX looks very similar to NIKK and MSCI ACWI etc: strong bounce into resistance, rejected with MACD in negative, flattening territory which indicates divergence with index price. This looks more ready for a retest of lows then for a continued rise.
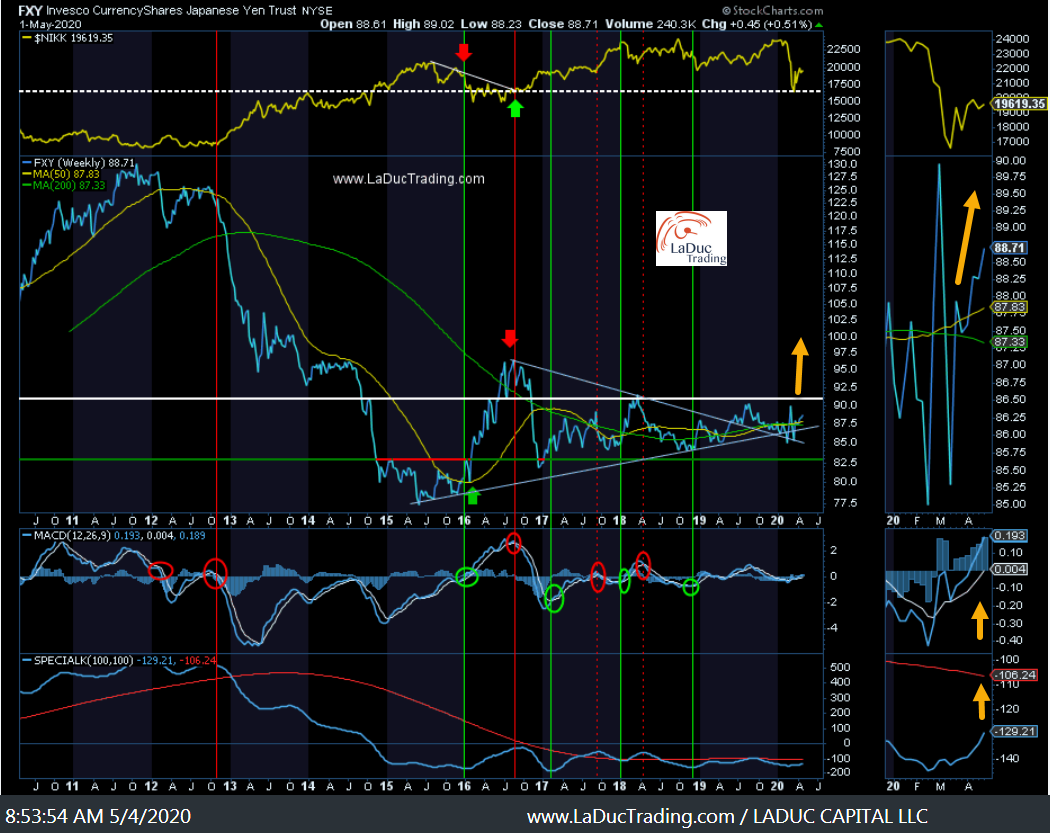
And with the NIKK looking anemic, I look to the Yen which looks strongish:
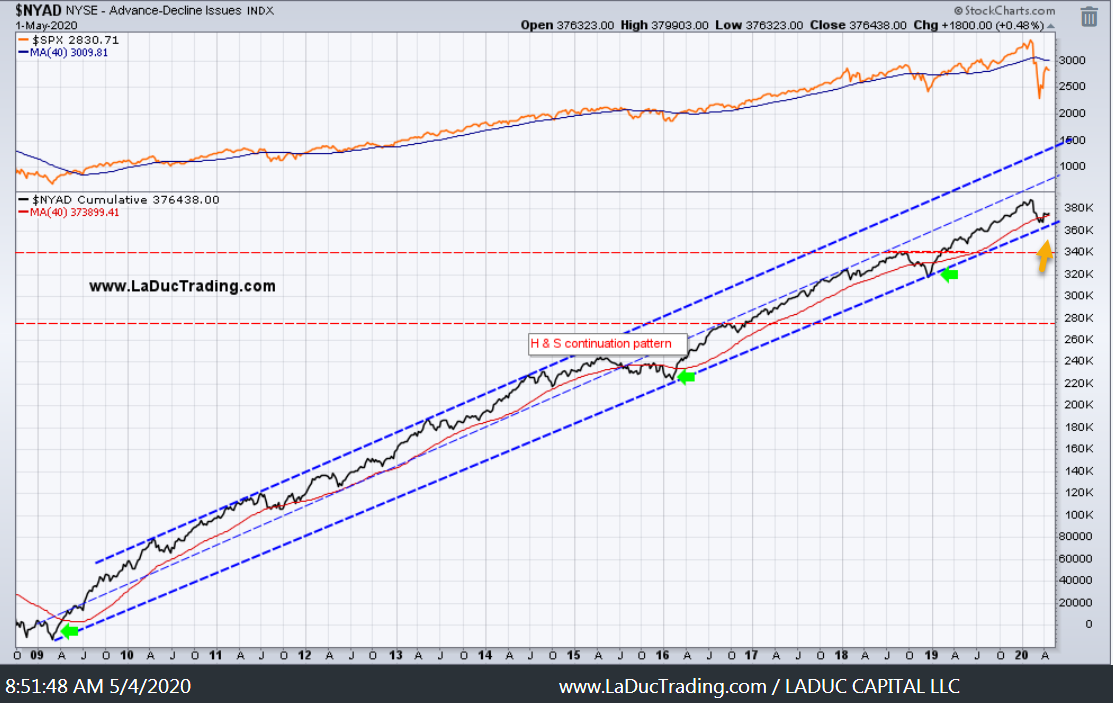
Breadth is just ‘meh’. I still contend that NYAD internals are weaker than SPX price action and as such are more likely to retest the bottom of the channel (blue dashed line where yellow arrow is pointing), and may even overshoot (red dashed line near 340K level).
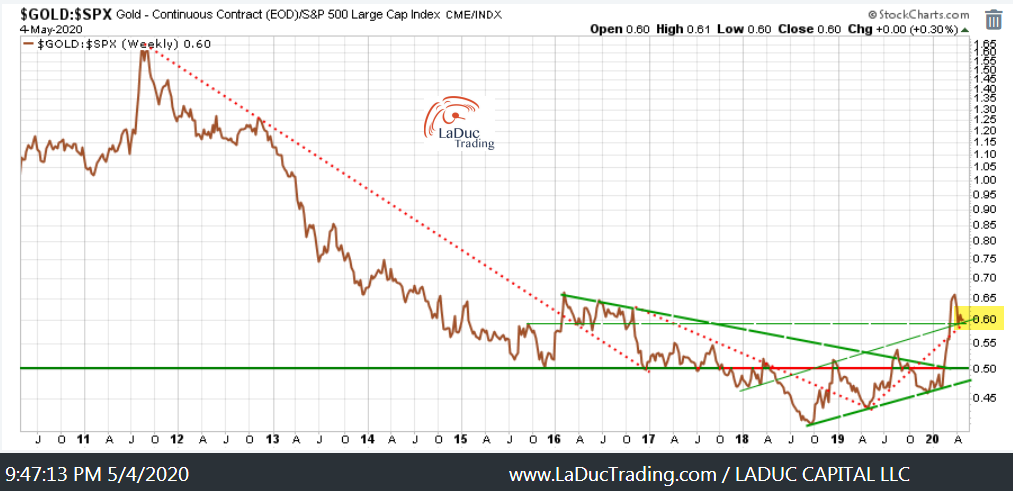
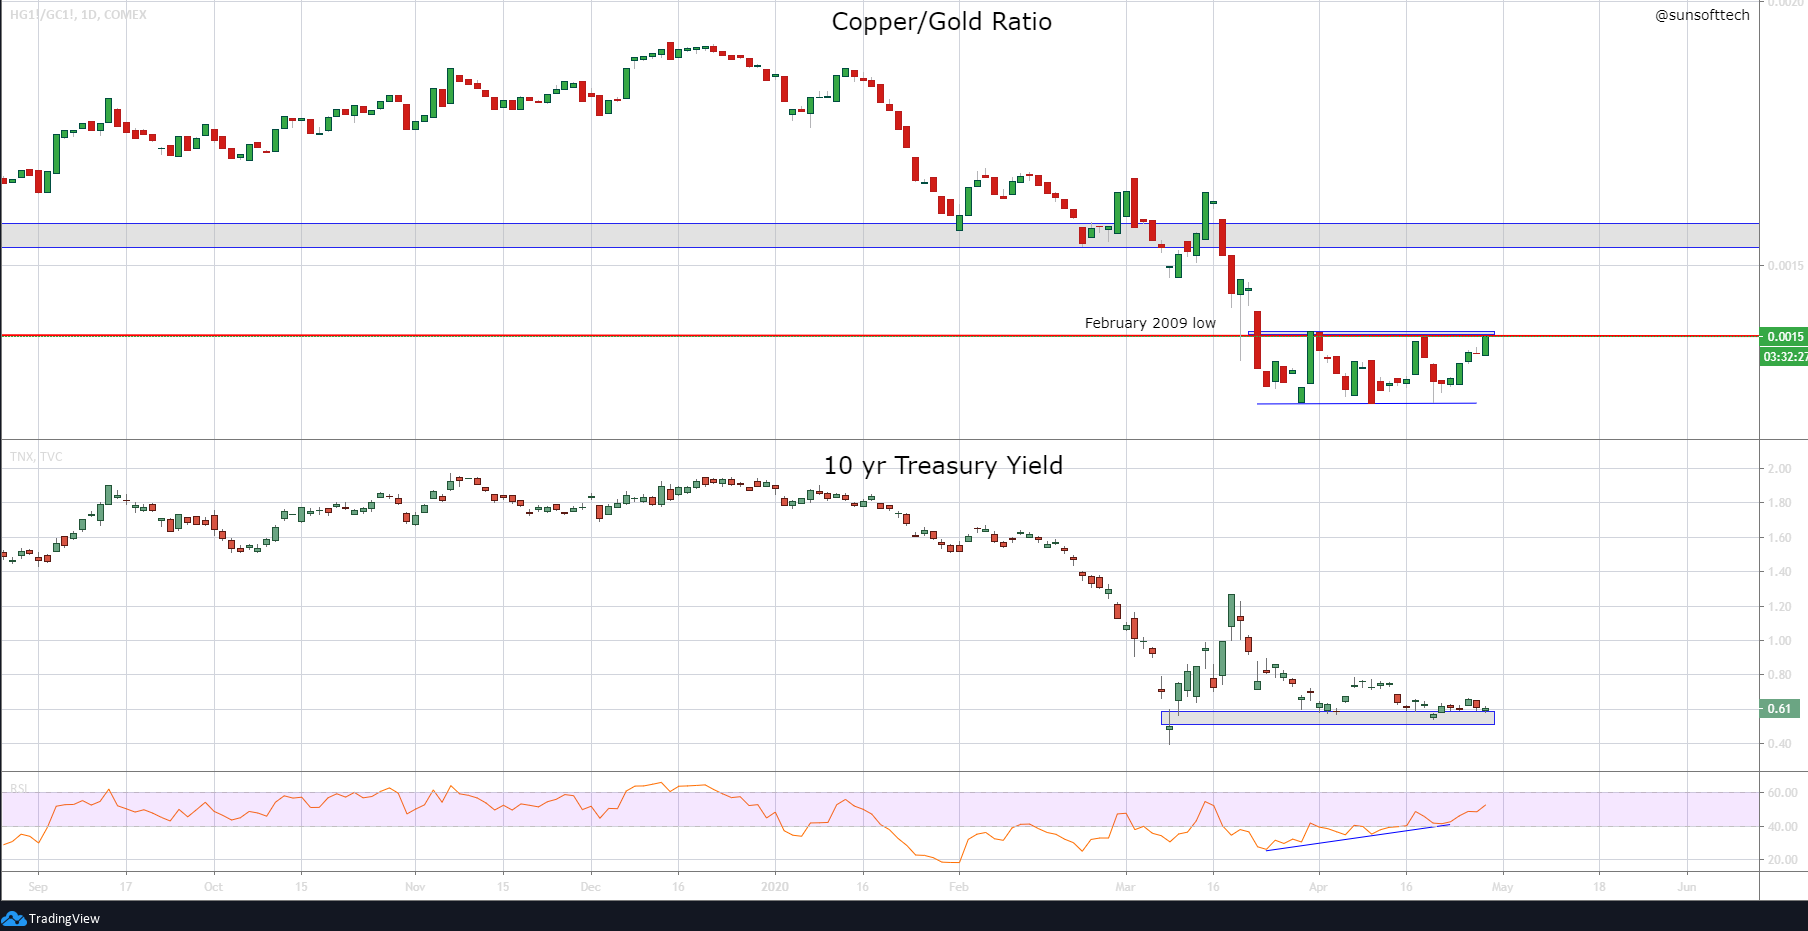
Gold relative to SPX is at an interesting juncture. A reminder that this was a helpful Tell for me to spy the March pullback.
No idea if Bonds pause here, but it is on my radar to watch yields much more closely now – especially after Mnuchin issues $3T in debt yesterday, which *should* cause a rate spike even if it doesn’t last long, and I don’t expect it to with Fed’s mandate to keep rates “lower for longer”.

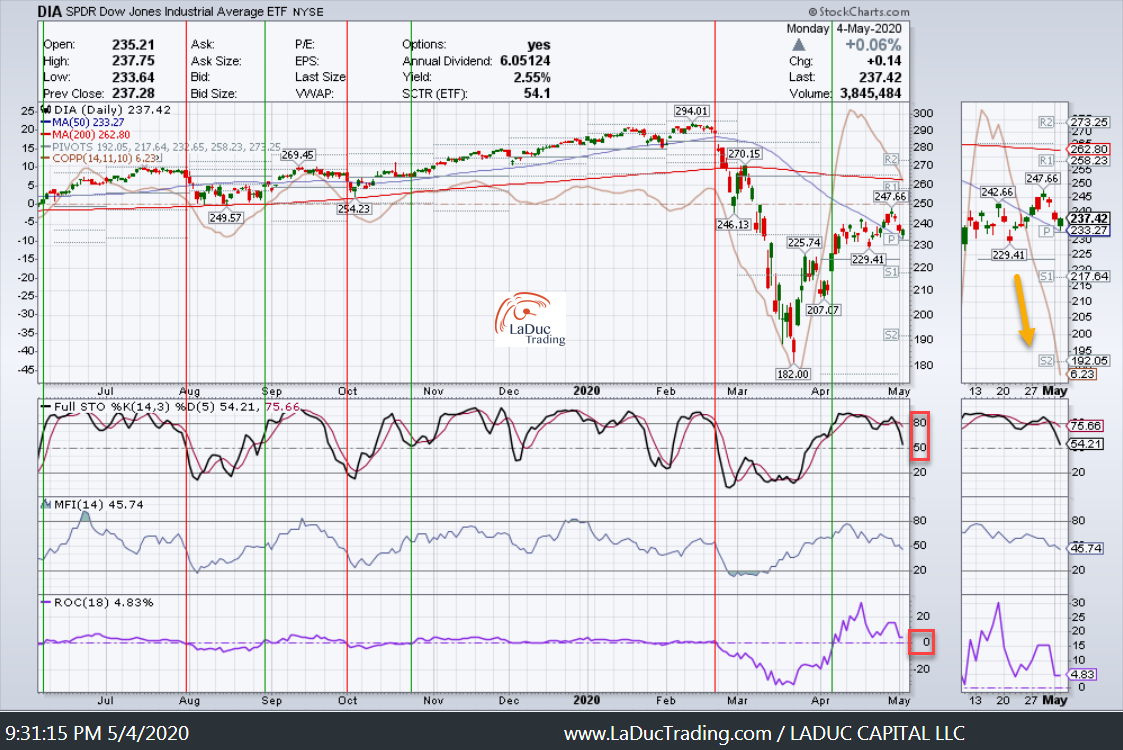
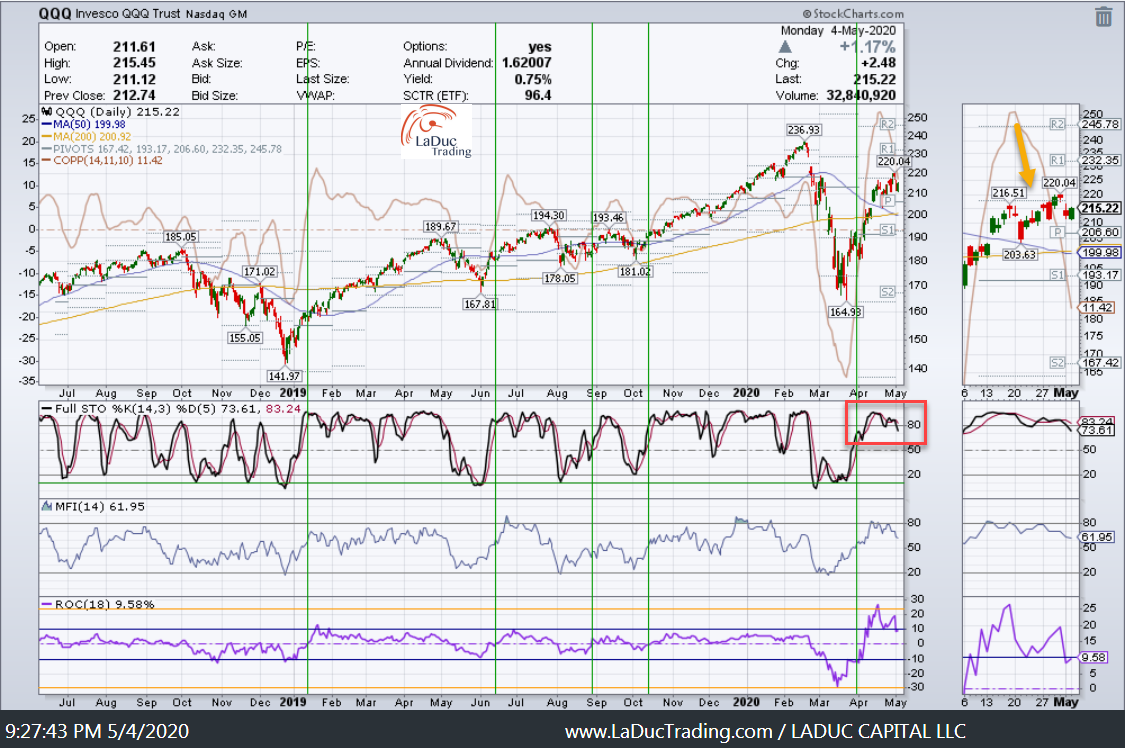
The following are my placeholders for the indices: SPX, QQQ, IWM, DIA.


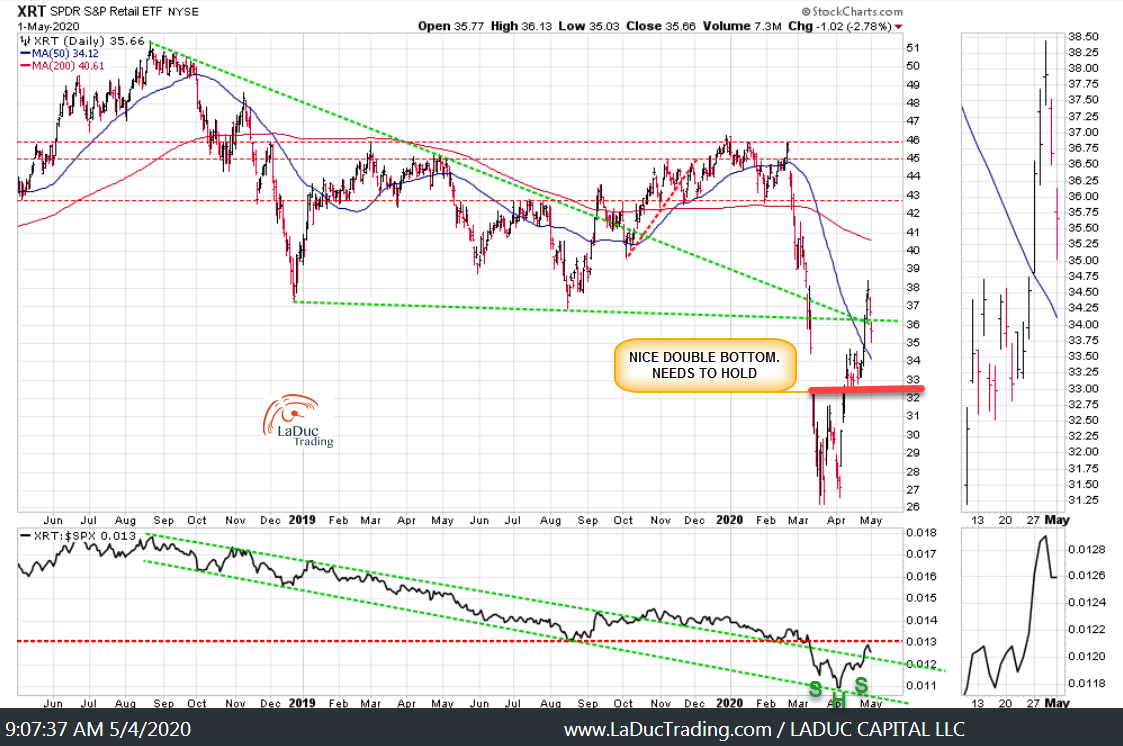
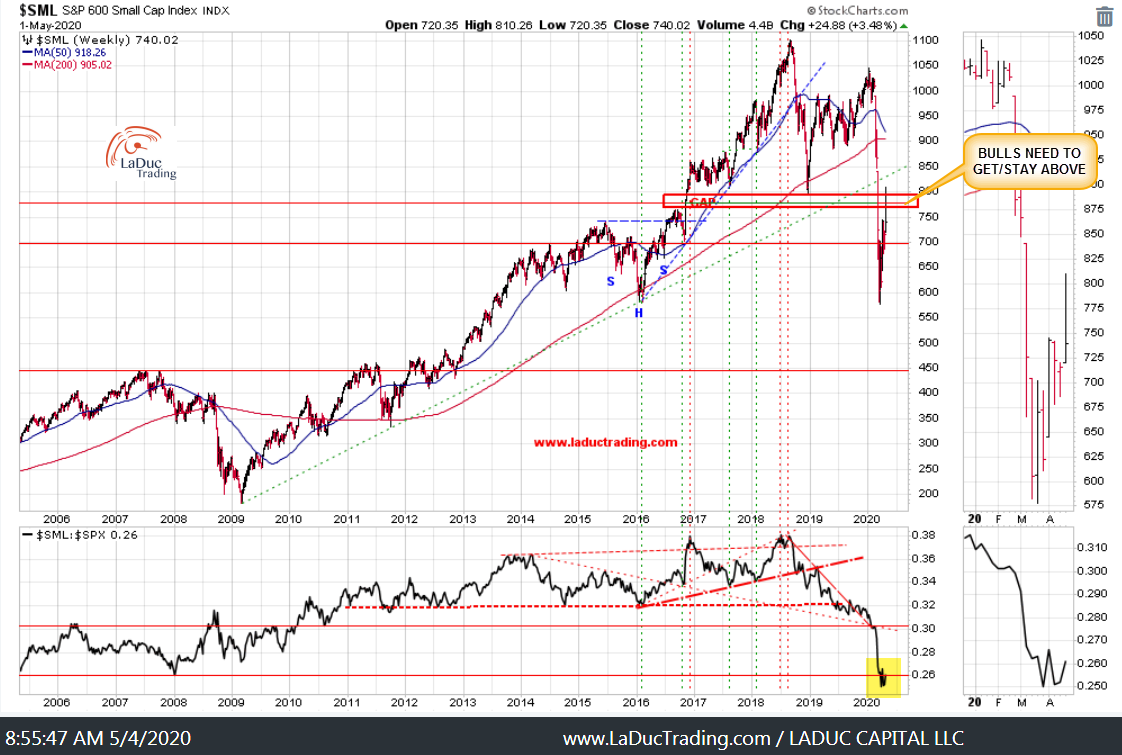
Sector Rotation – when it hits again – will have me spying trades in oversold, left-for-dead retail and small caps again. Basically, secular growers into cyclicals/value.
Lumber with Yields?
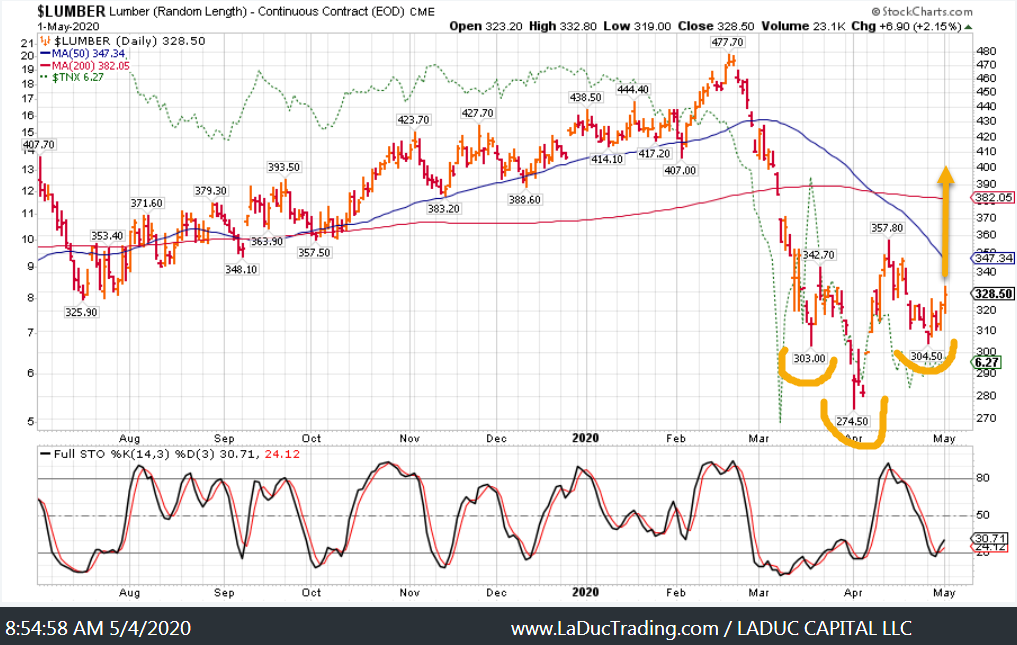
Speaking of yields and commodities …
And despite Tech seasonality in May, and unlimited printing by Treasury that finds its way into ‘safety’ plays FAAMNG, I somehow still think this notable Tech:Energy divergence gets resolved in coming months.
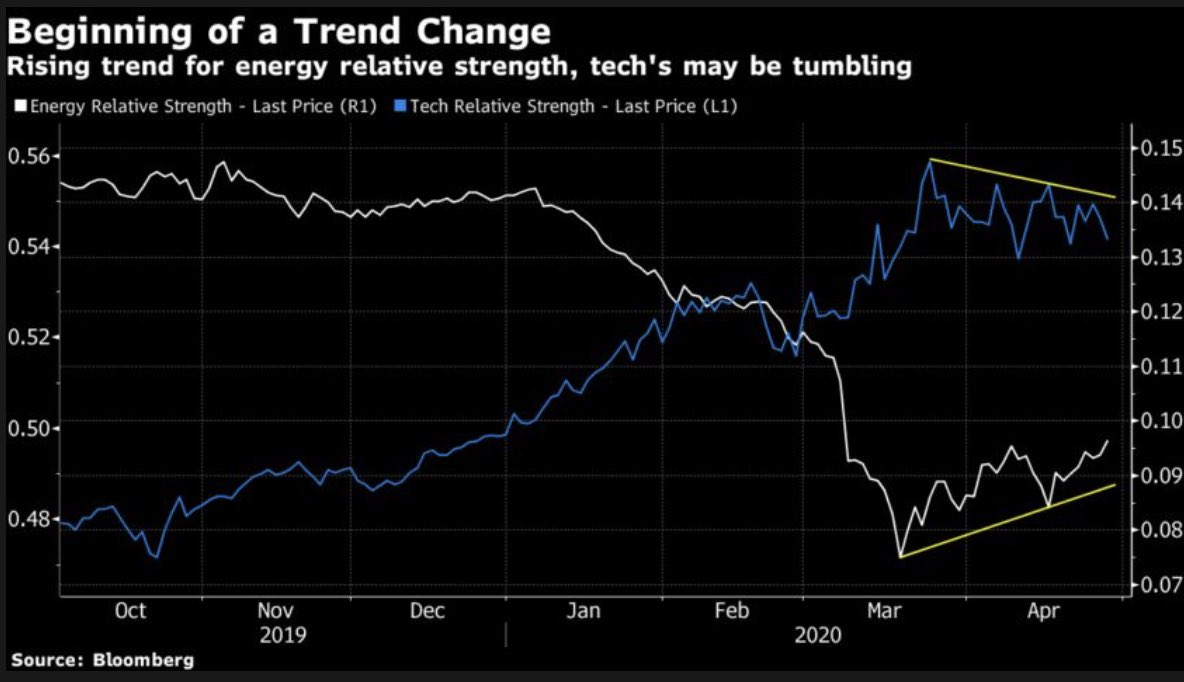
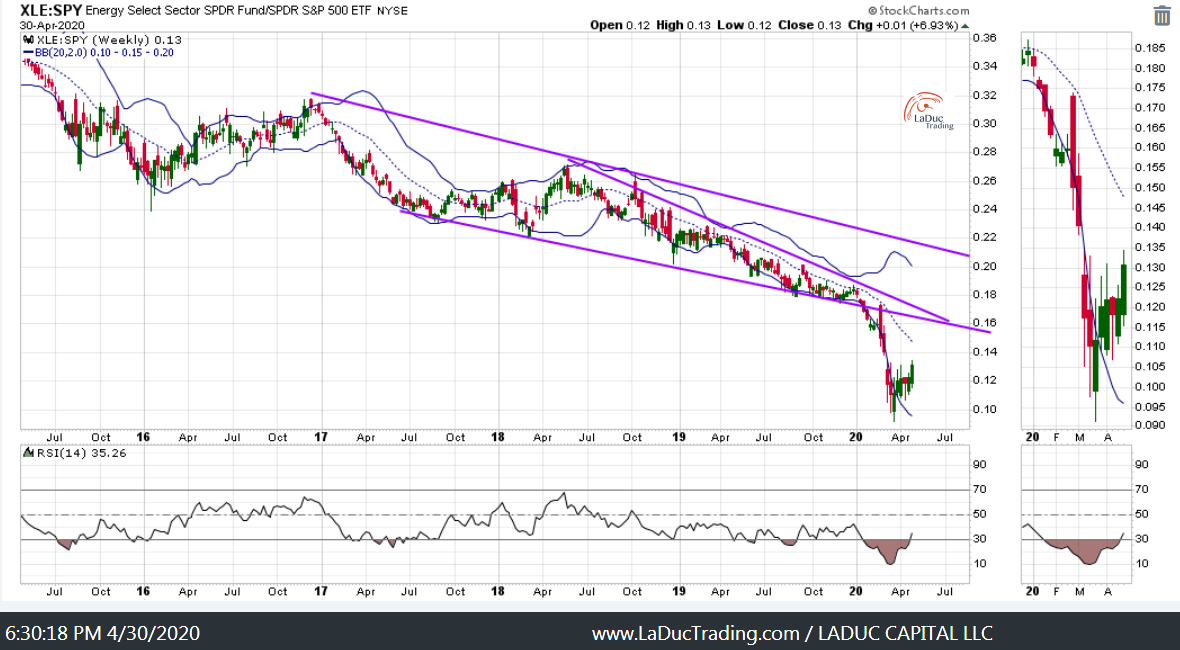
To that end, let’s see if some stabilization occurs in the Energy patch. WTI Crude is already up +$61.63/bbl or +153% off the lows just 3 wks ago. I would not be surprised for Oil to fail here, and Oil&Gas to pull back, but my point is Relative Strength of XLE companies relative to the commodity and SPY.
SPY Roadmap
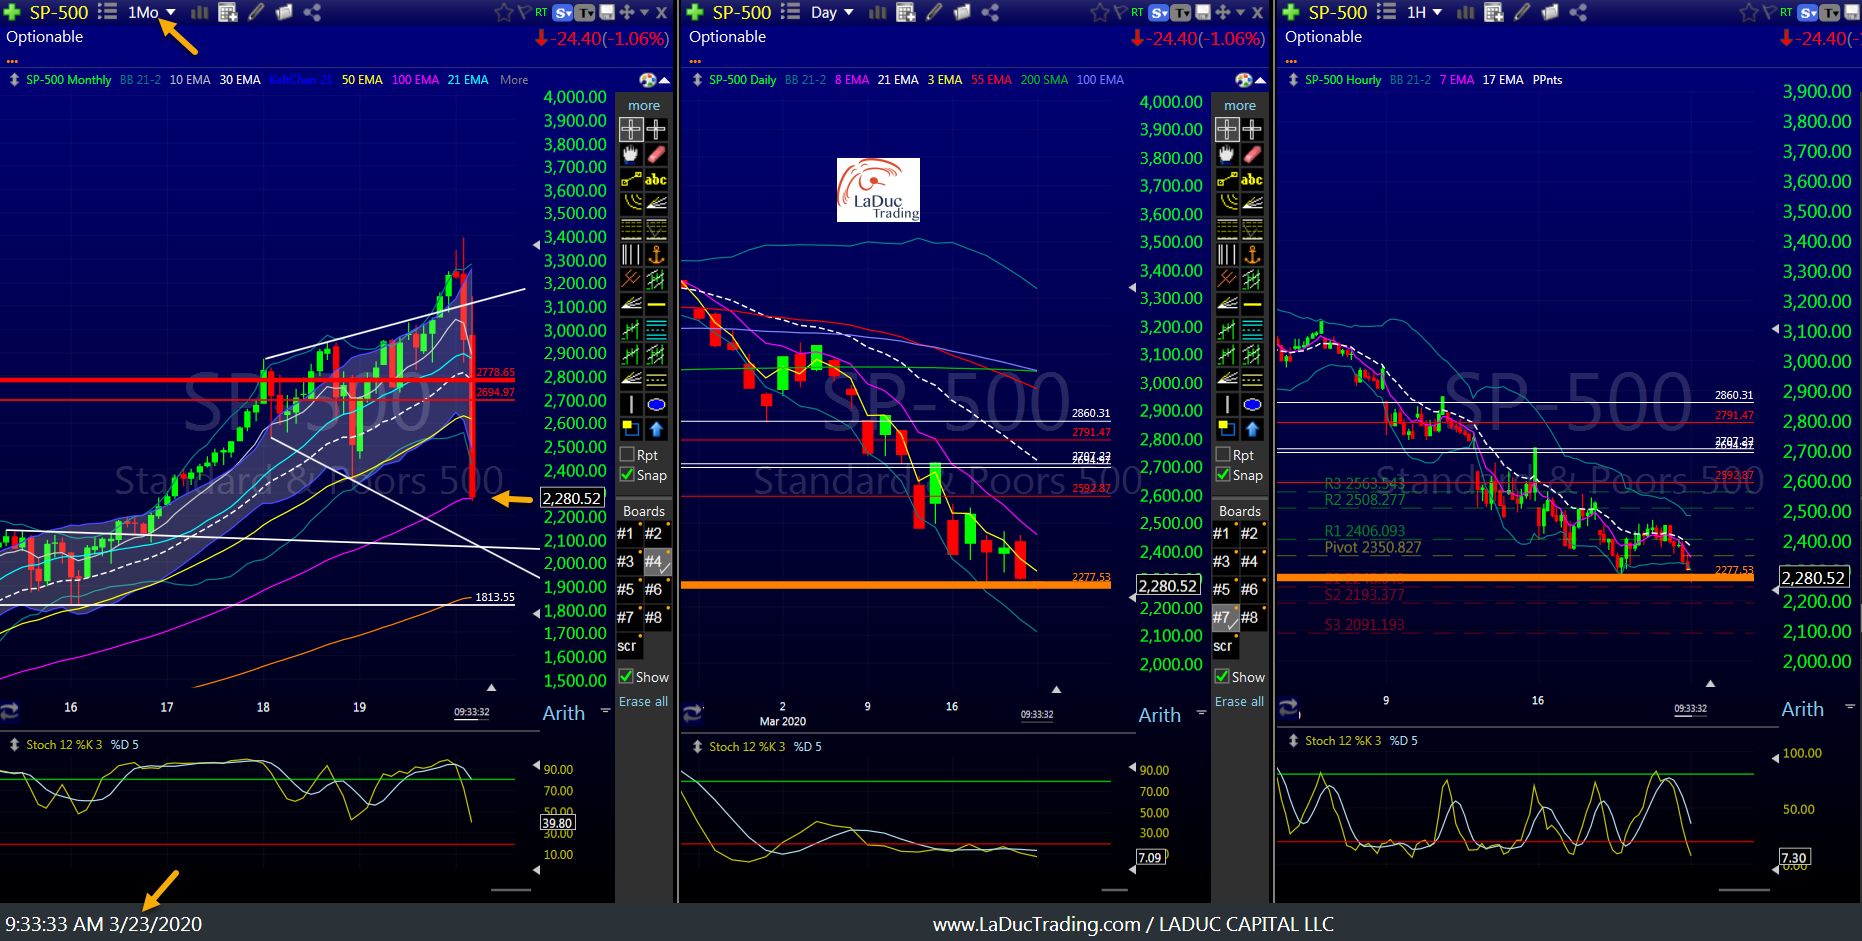
This is what I presented to clients March 23rd: Big Picture THEN: cover shorts and expect a bounce, we indeed had our bounce.
NOW – SPX is up 28.5% to my $2873 (quarterly) price target. I said I expected a sharp rejection at $2873 then retest lower. However, note, SPX closed above the 10WK which is bullish. With that, I wouldn’t be surprised to see the chop into $2956 begins…before reversing down in May.
SPX tagged $2955 on Wed April 29th.
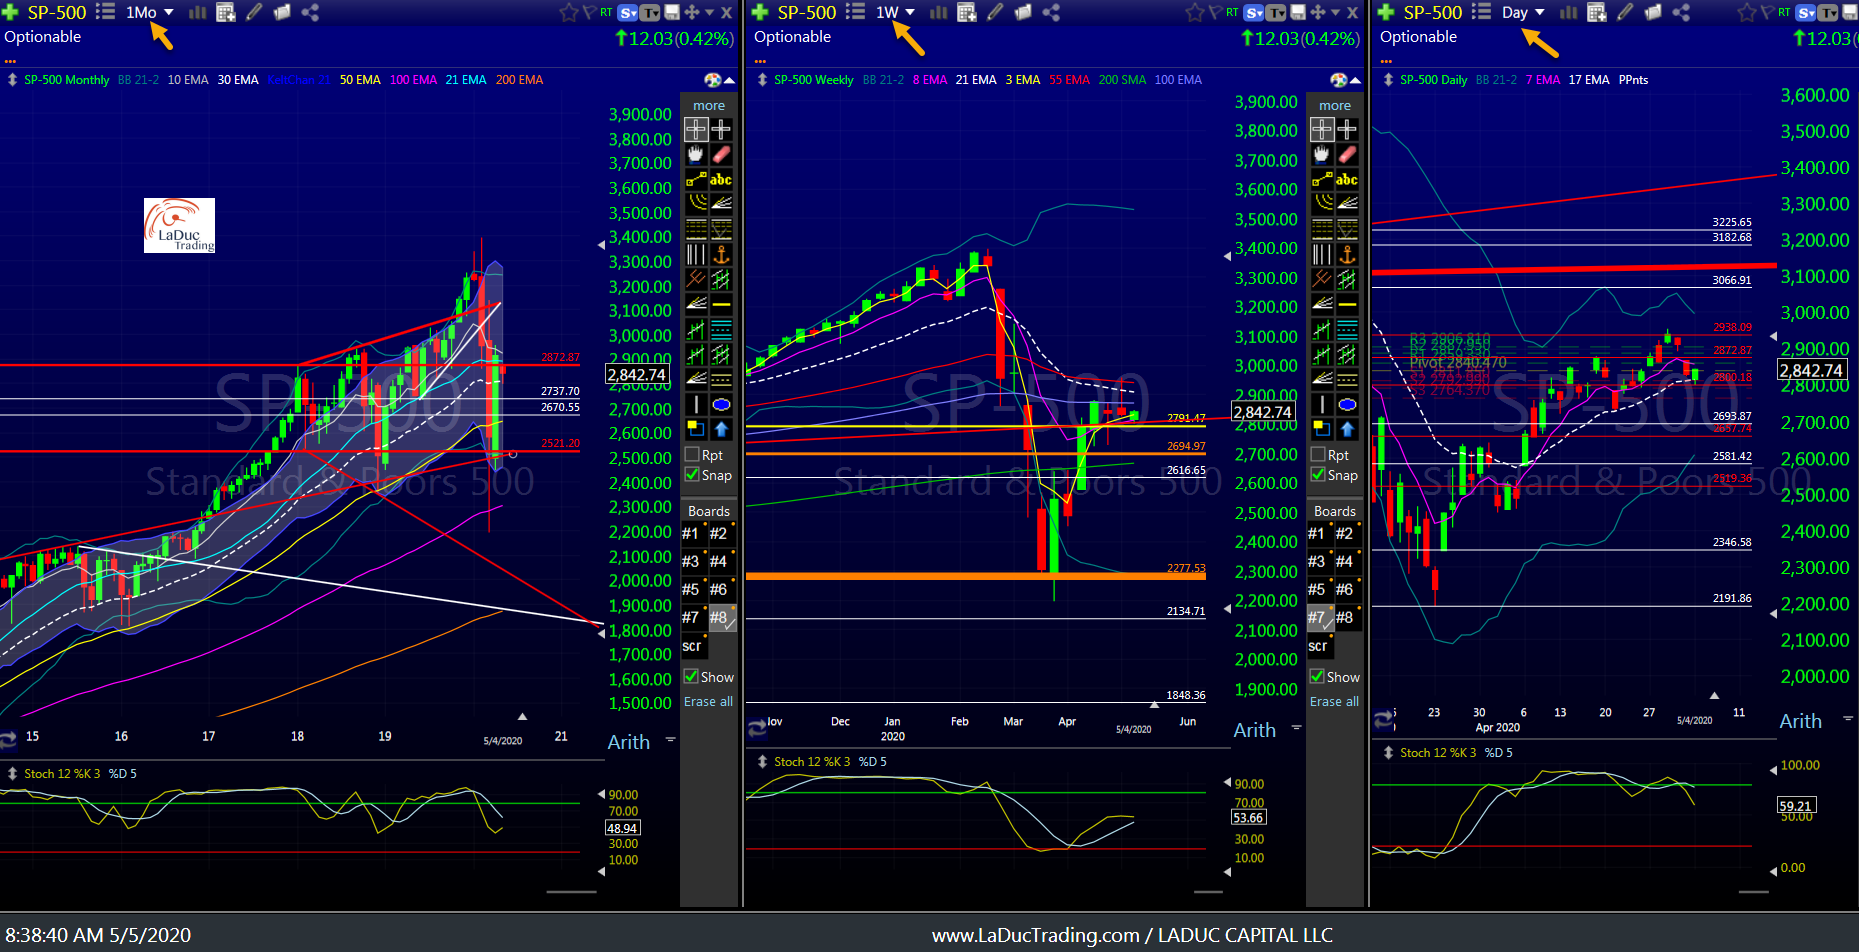
We are now in May. With Nobody left to Squeeze.
Top 5 Market Risks remain despite Fed intervention and government stimulus disaster relief money:
- US-China Trade Relations and Supply Chain Woes
- Mortgage Crisis Deepening
- USD Spike from Global Shortage
- COVID19 Depression on Main Street
- 2020 Election and Social Unrest