Key Charts from the Week:
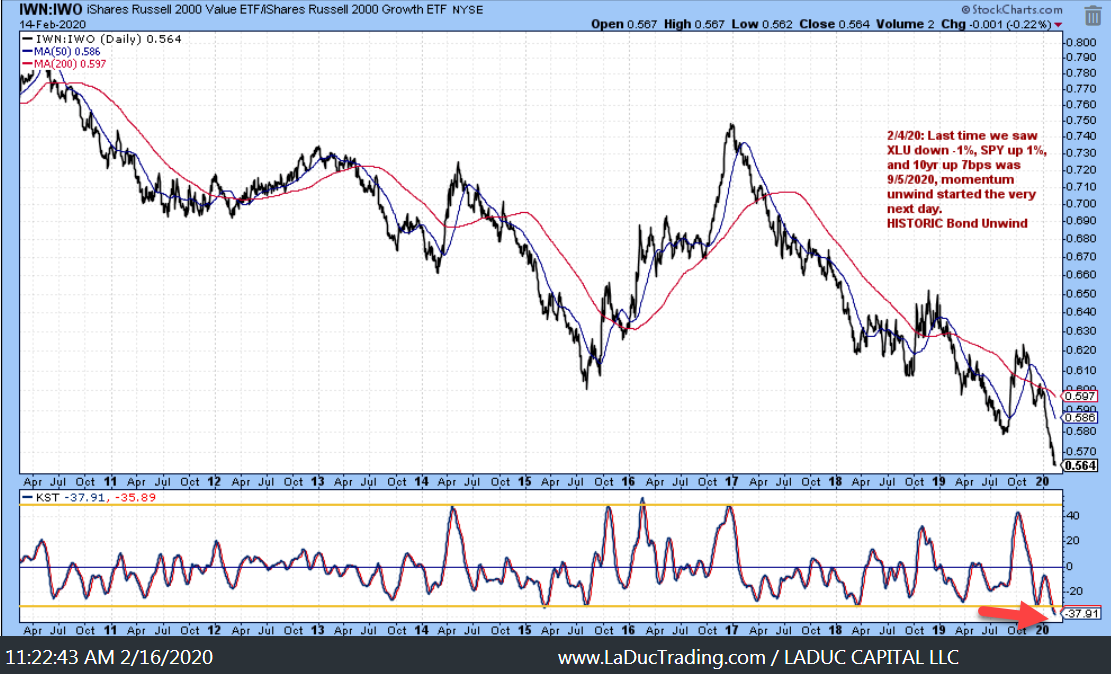
- Growth to Value
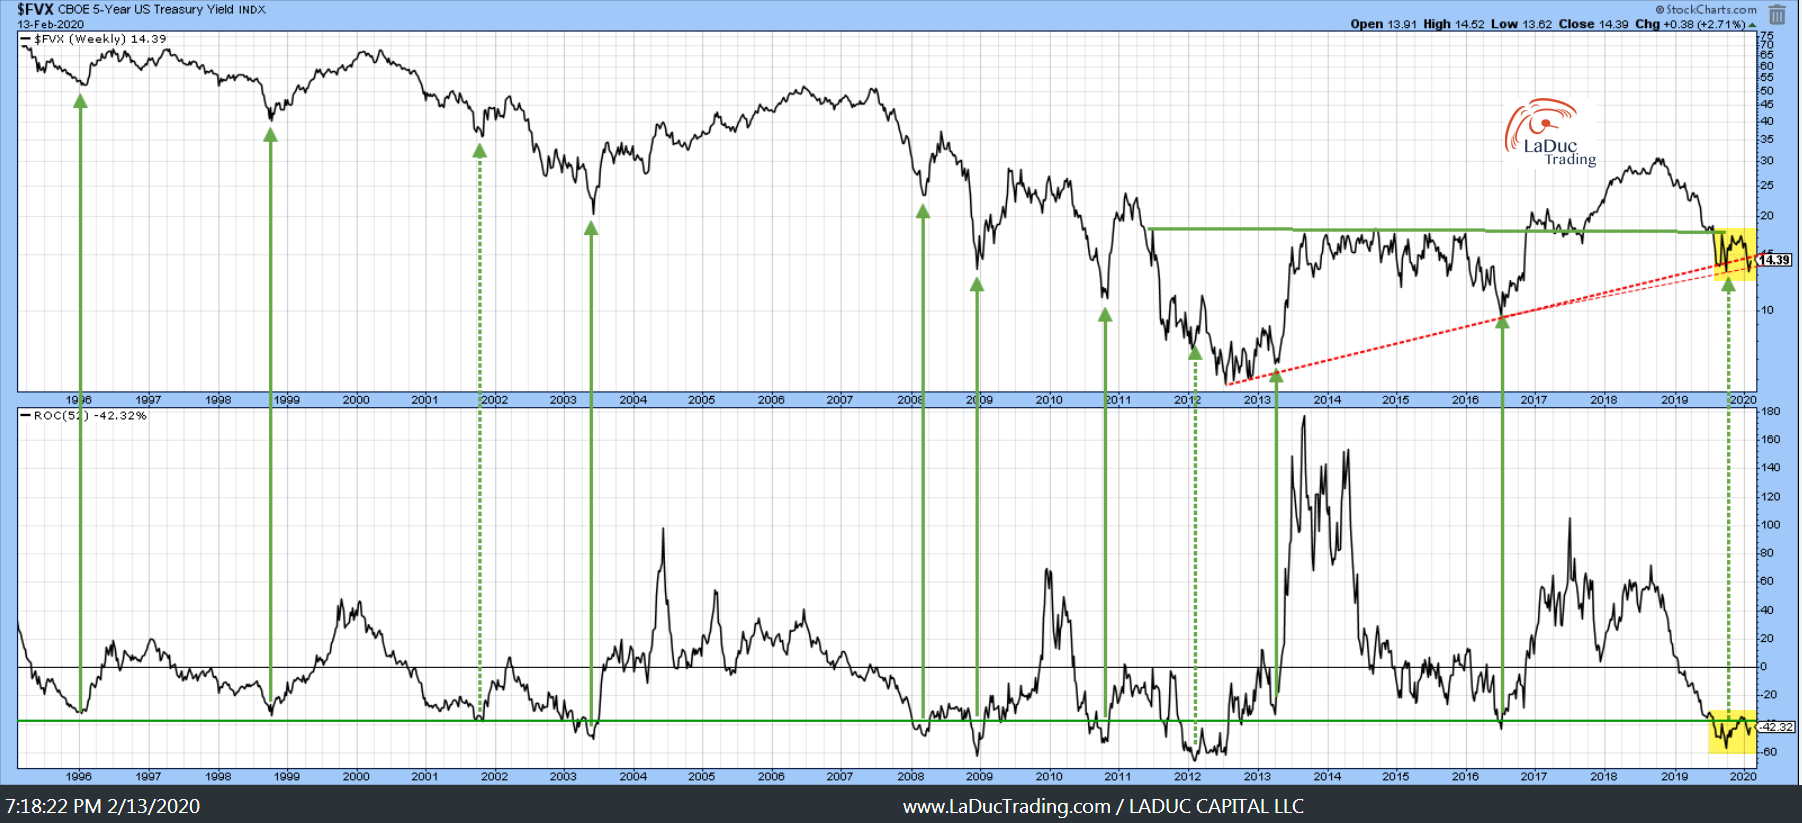
- Rates
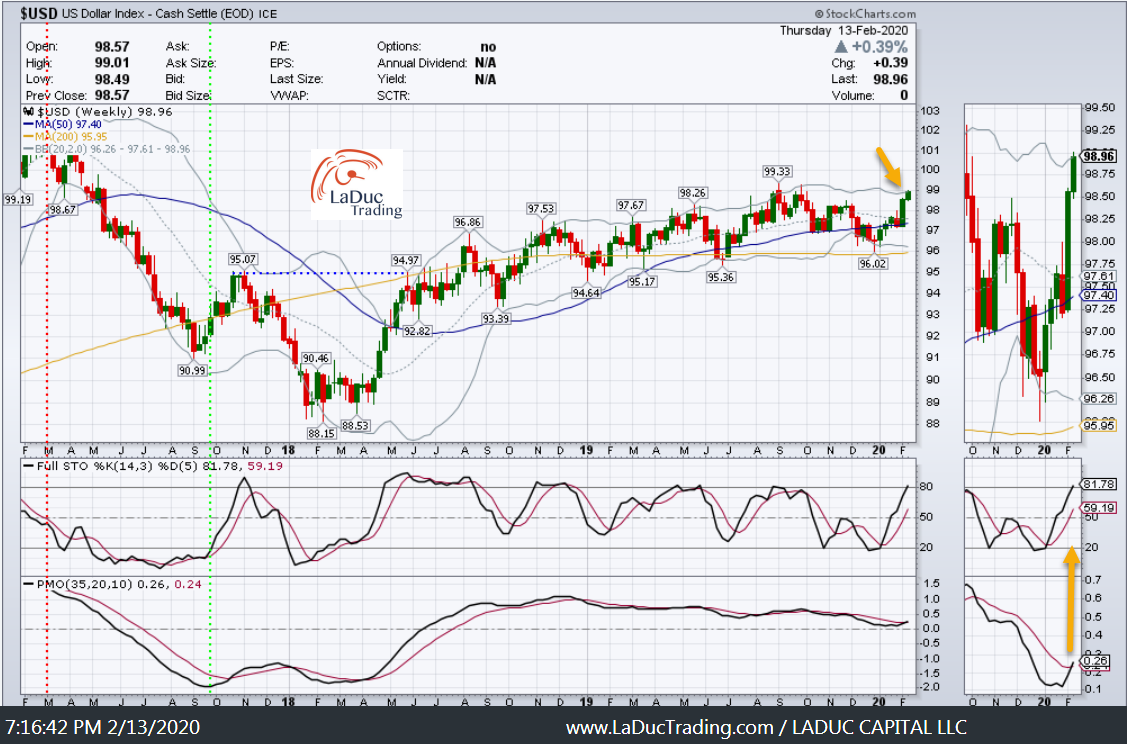
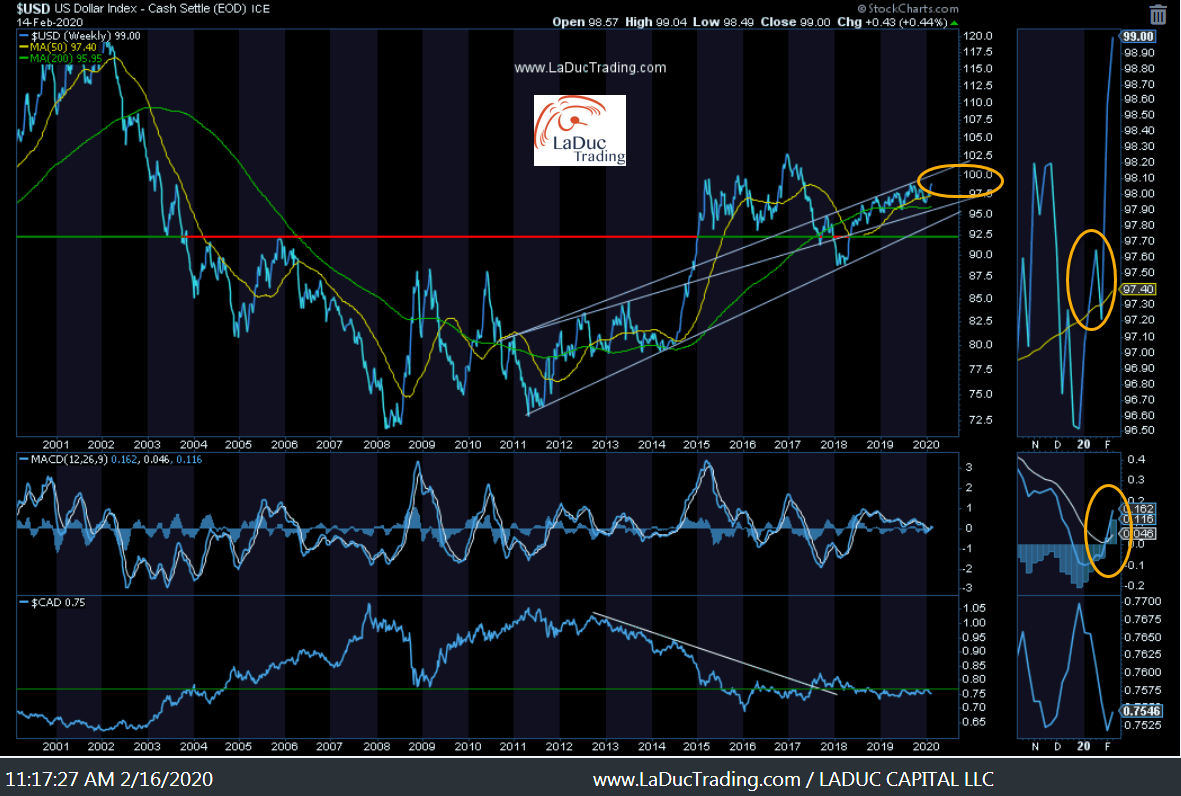
- US Dollar
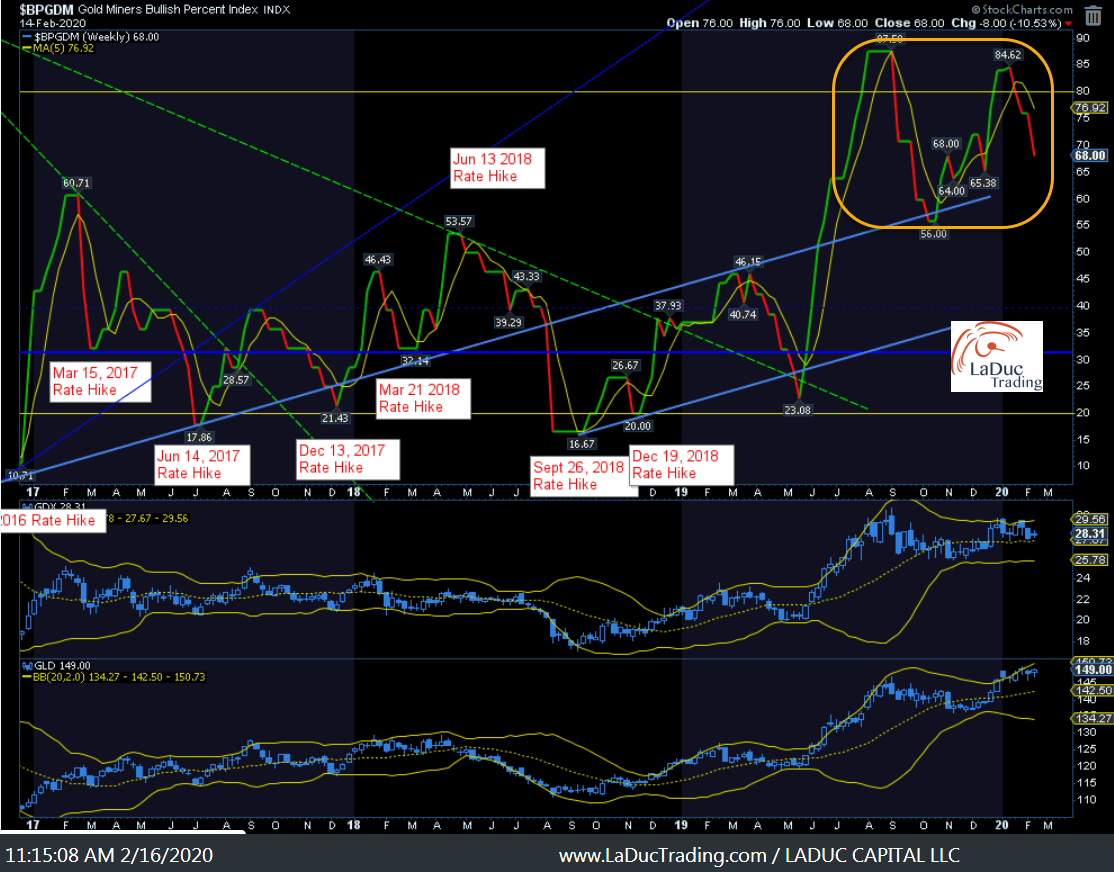
- Gold/Miners
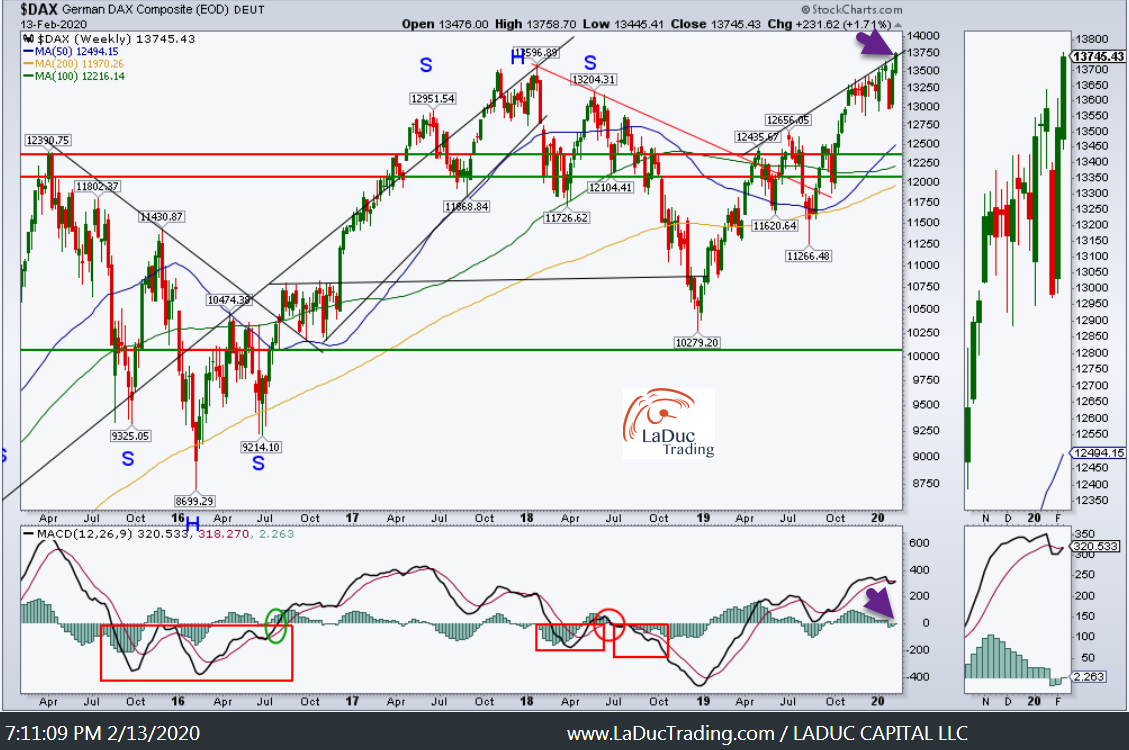
- Germany
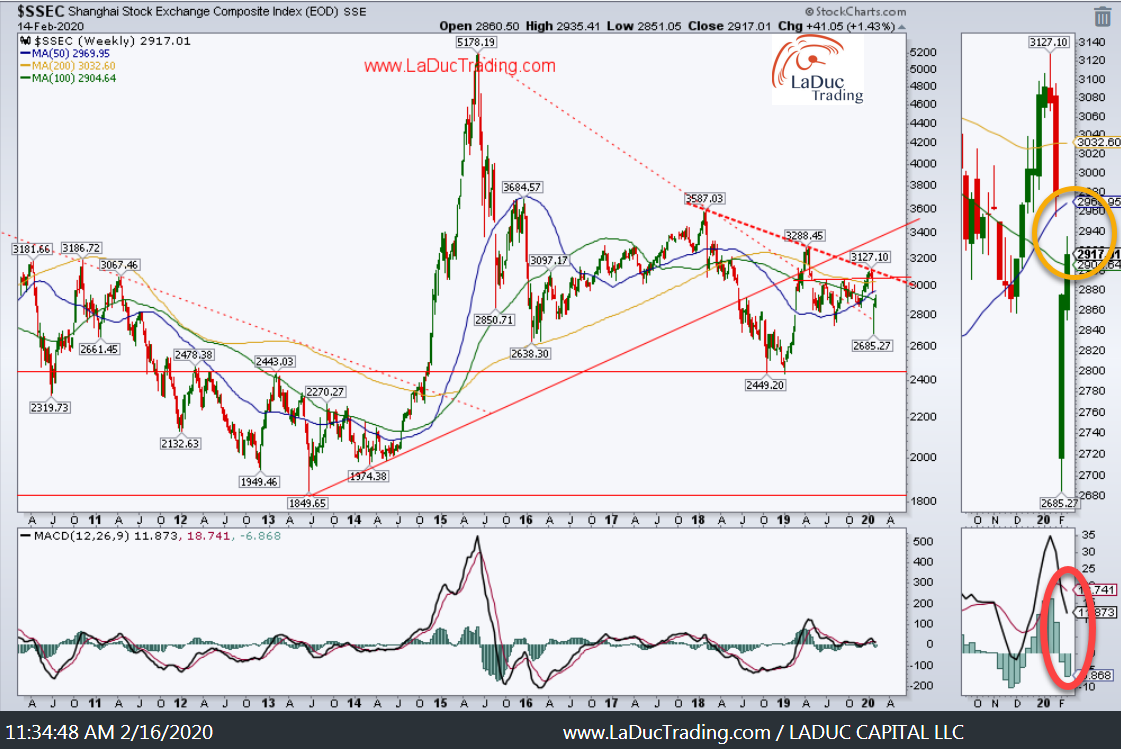
- China
- Oil
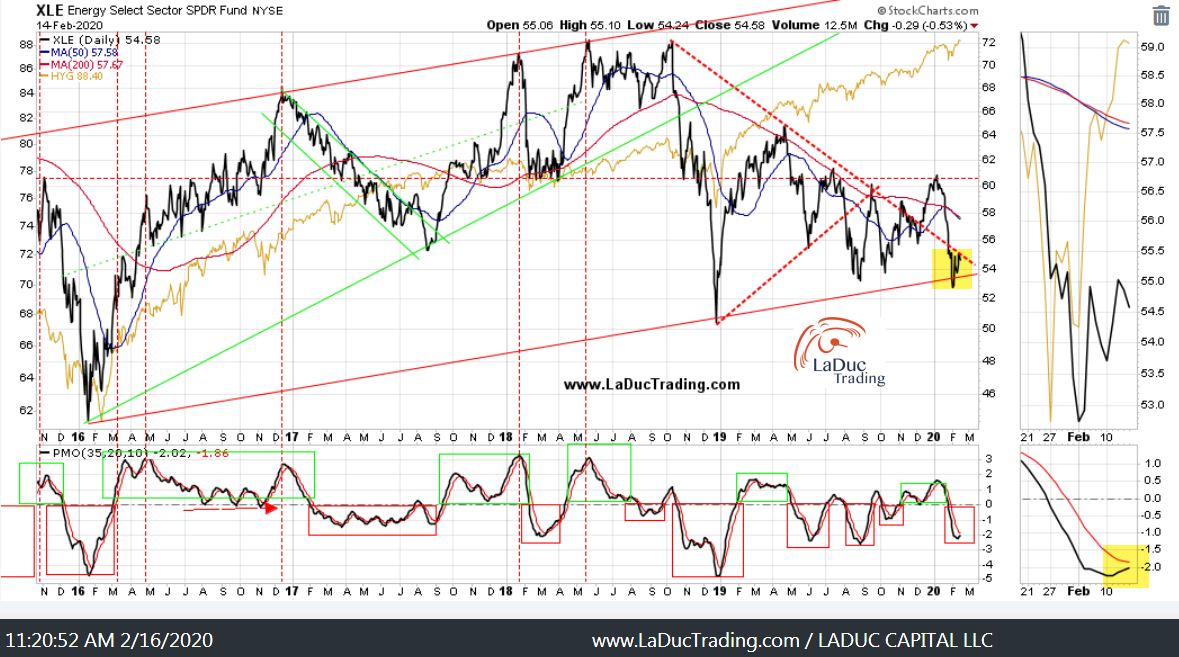
- XLE
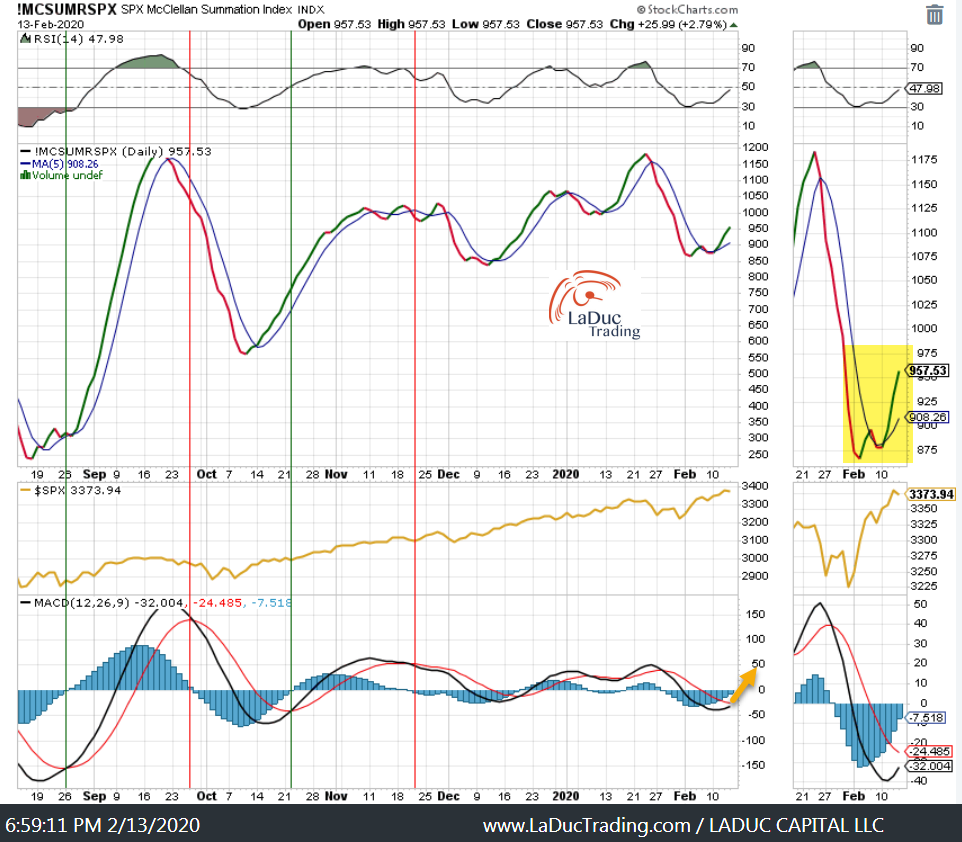
- SPX Momentum
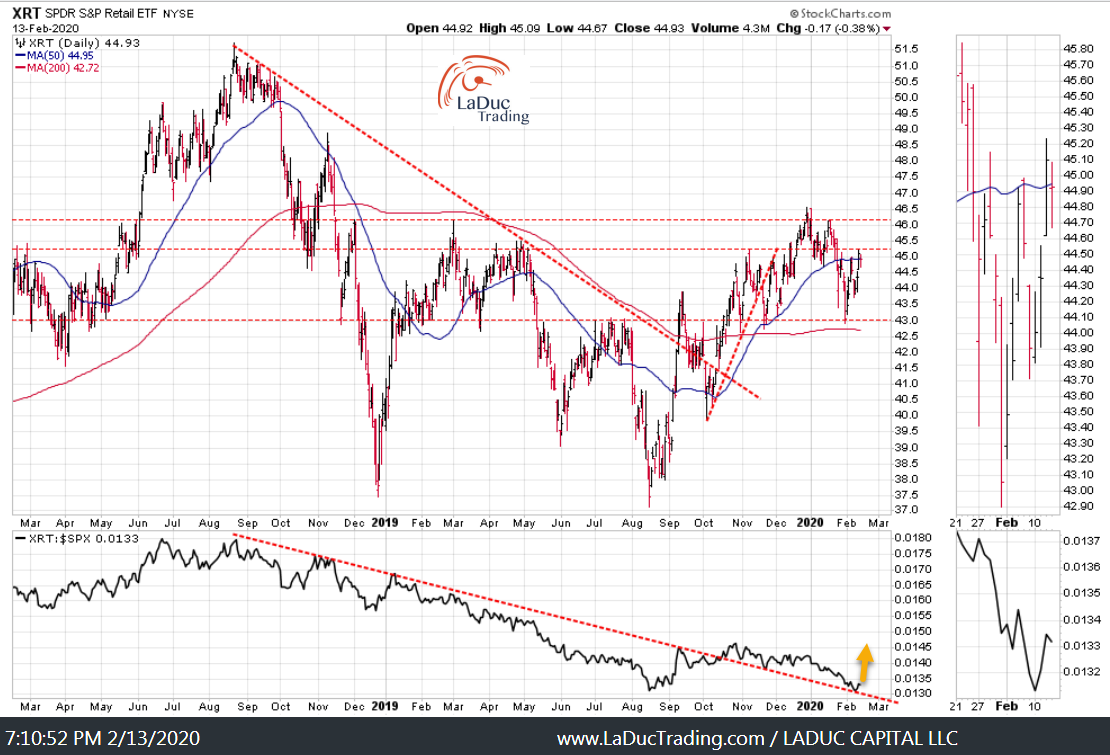
- Sector Spotlight: Retail
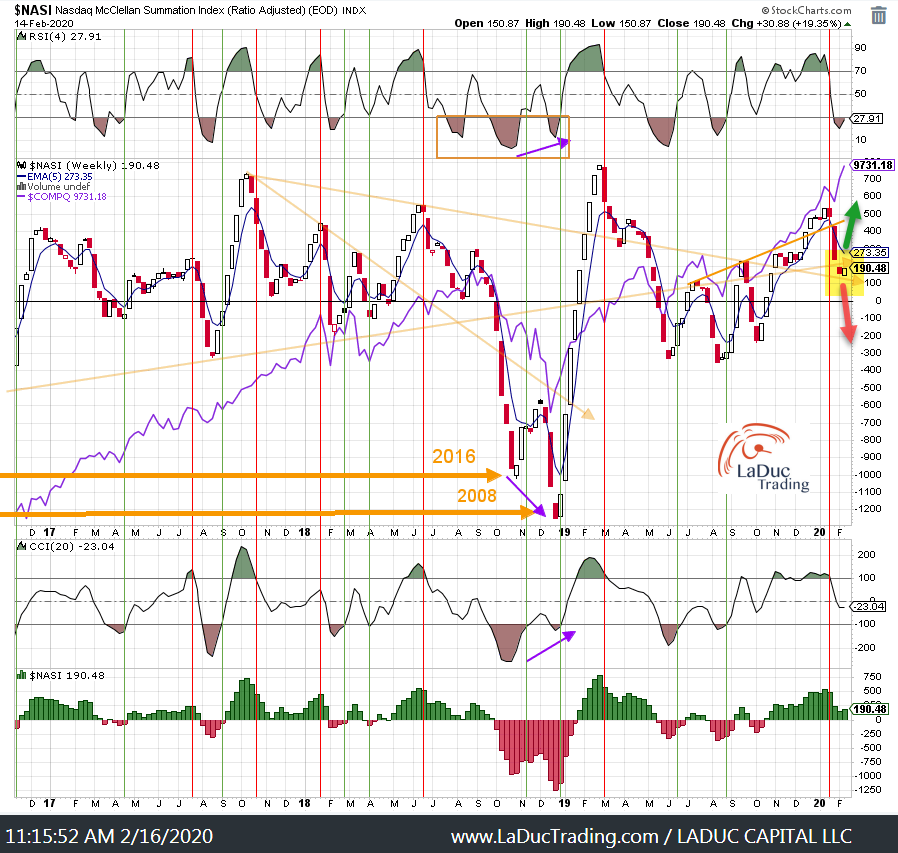
- NASDAQ Momentum Divergence
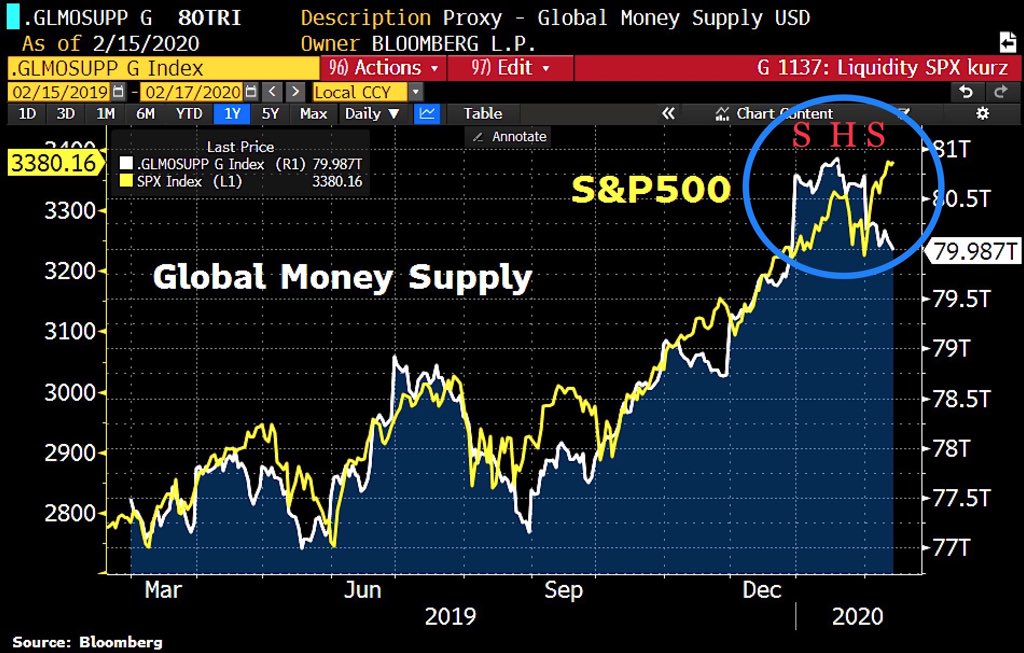
- Global Money Supply in USD
Growth to Value Rotation – Someday. All things being equal… well, they aren’t and FAAMG is keeping this bifurcated market aloft. The rubber-band or alligator jaws or whatever metaphor you want to use all say the same thing: Outliers Revert With Velocity
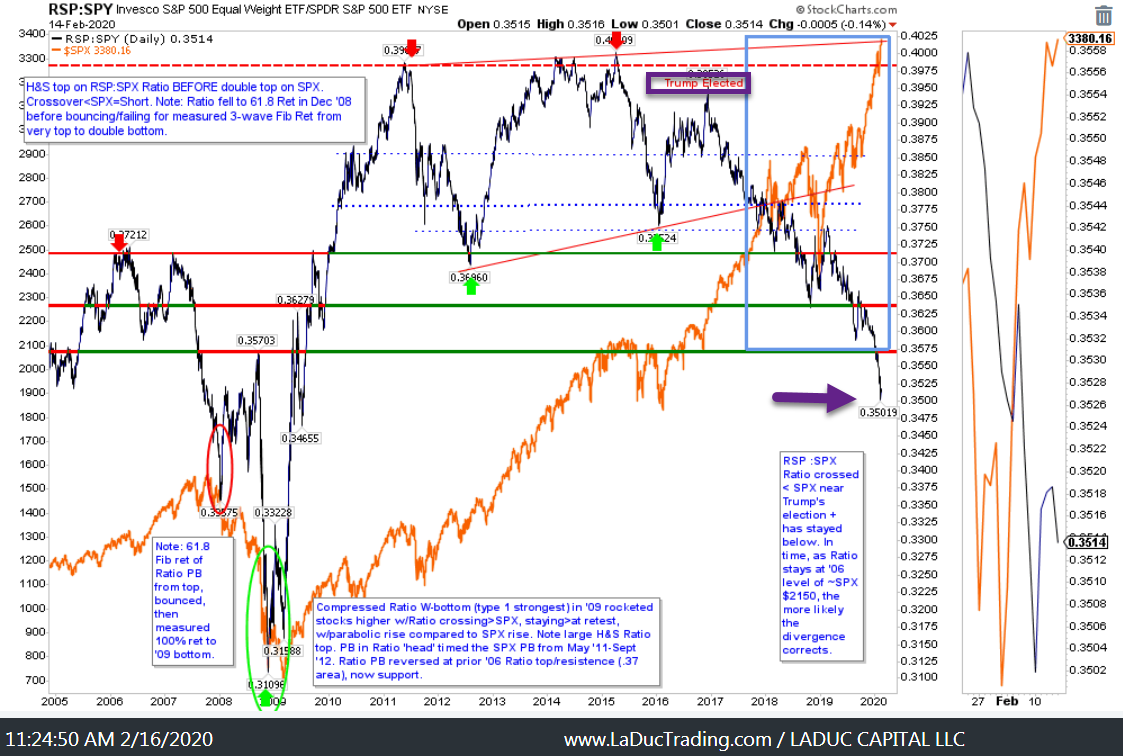
My Russell Growth-to-Value rotation chart is a snap-back play just waiting to happen and here is a handy list of Top 100 Most Heavily Shorted Stocks to reference when time:
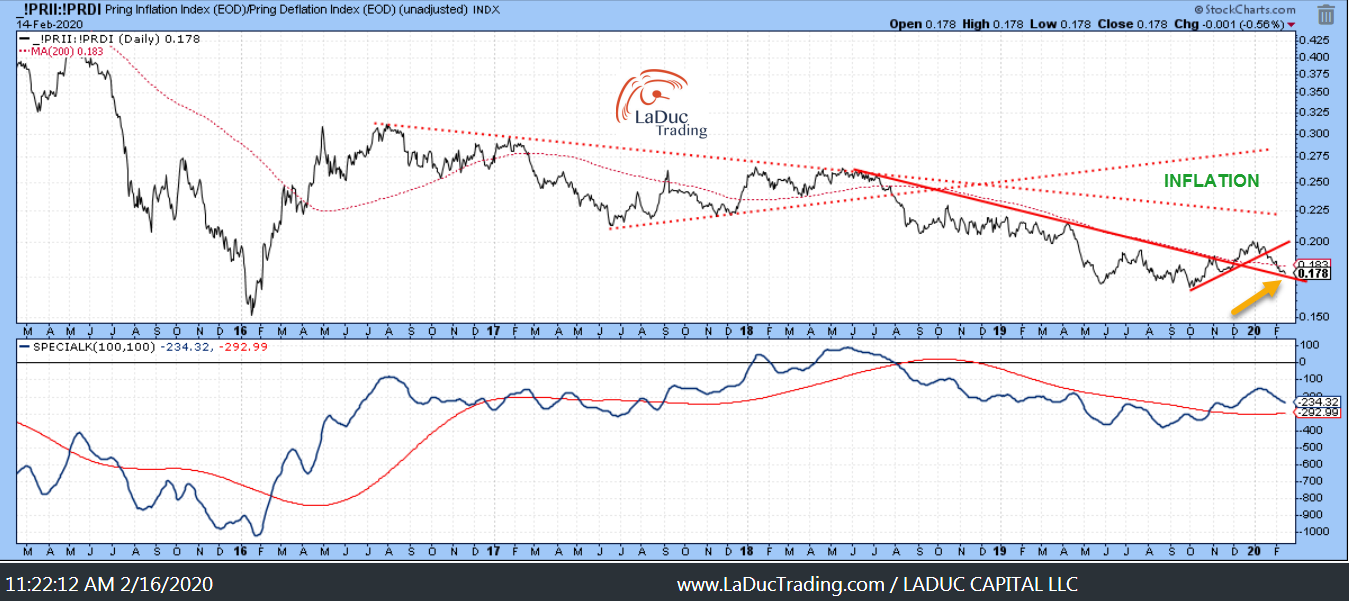
Inflection point with rates which will follow inflation or deflation.
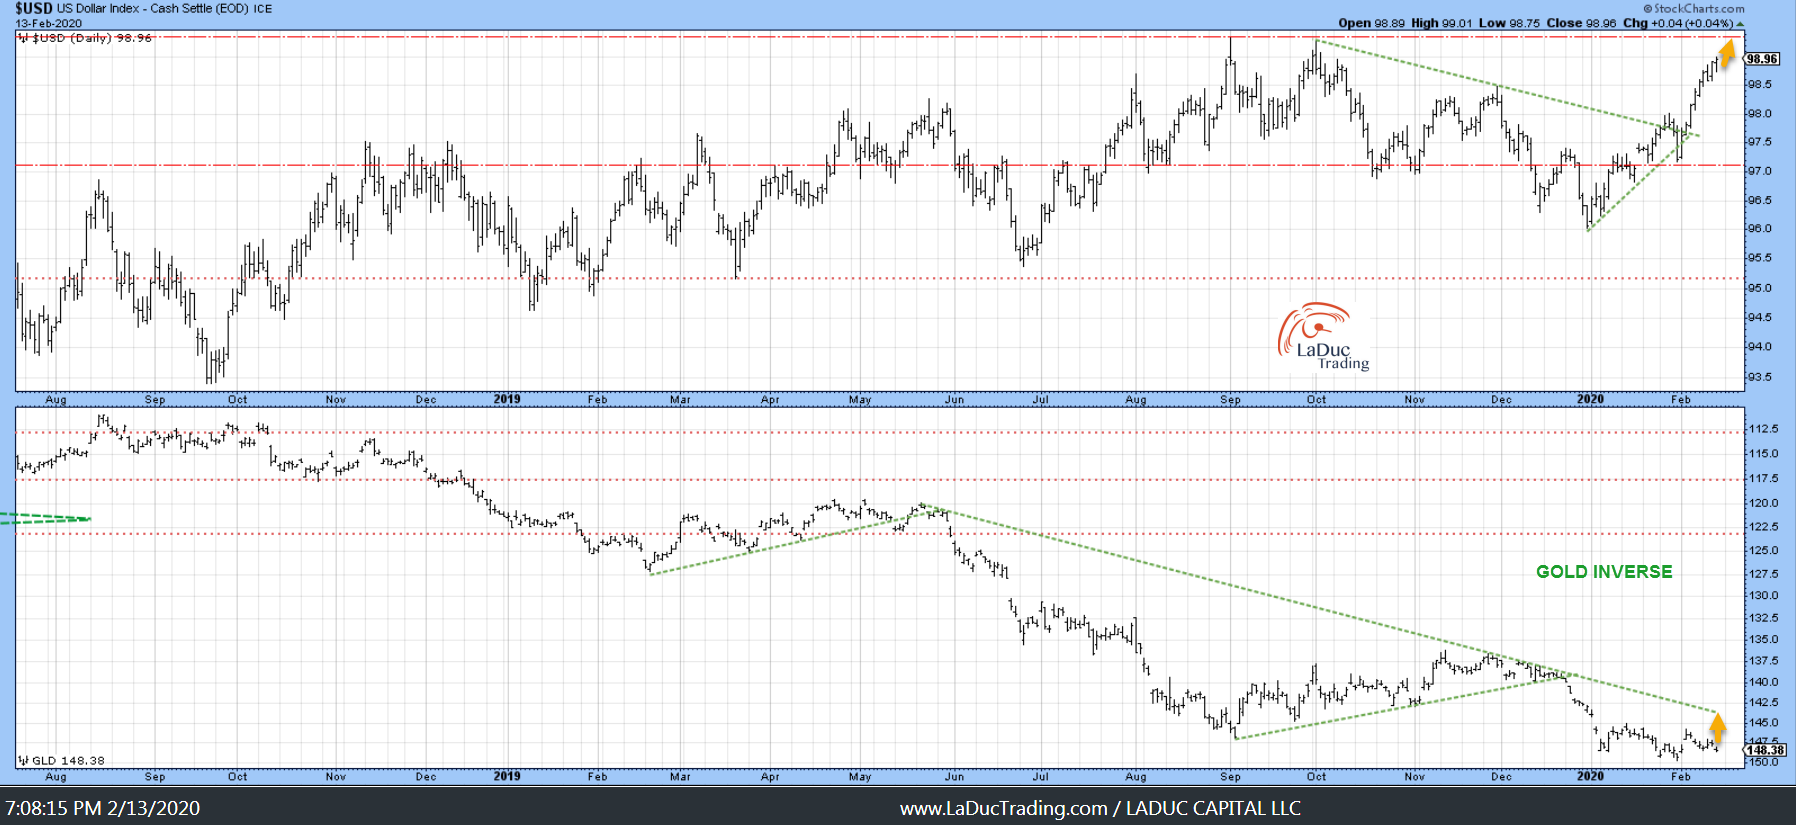
Gold Miners still look like they will head lower but price hasn’t confirmed.
Germany, really? They are in a technical recession and and and…
China still has no short-selling (or selling period) allowed while under quarantine so this chart isn’t really a surprise.
Oil prices rise despite the IEA saying global oil demand will drop this quarter for the first time in over a decade as the coronavirus batters China’s economy
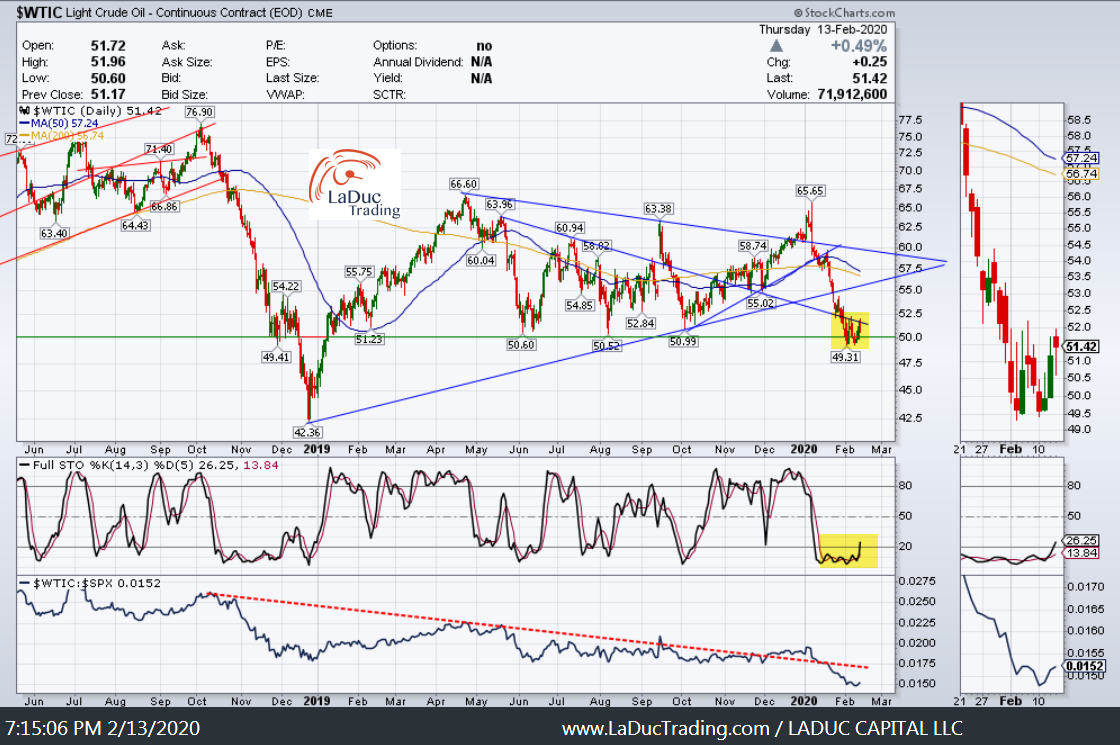
Crude Oil has bounced off $49 to $52, setting up to perhaps $55 where it is a better short than long. XLE is still trying to decide.
SPX Momentum still has some.
Maybe Retail is a good place to fish. WMT reports Tues and others soon after.
Nasdaq breadth continues south despite indices moving strongly north.
Most Important Chart
Global Money Supply has dropped relative to SPY because the USD has risen. Even with China injecting 380B of stimulus past 2 wks to try and combat COVID-19 fears and economic paralysis. But this Head + Shoulders pattern is either ‘A Top’ of some significance OR a Continuation of the trend in the making and why it earns my “Most Important Chart” status.