Market Thoughts
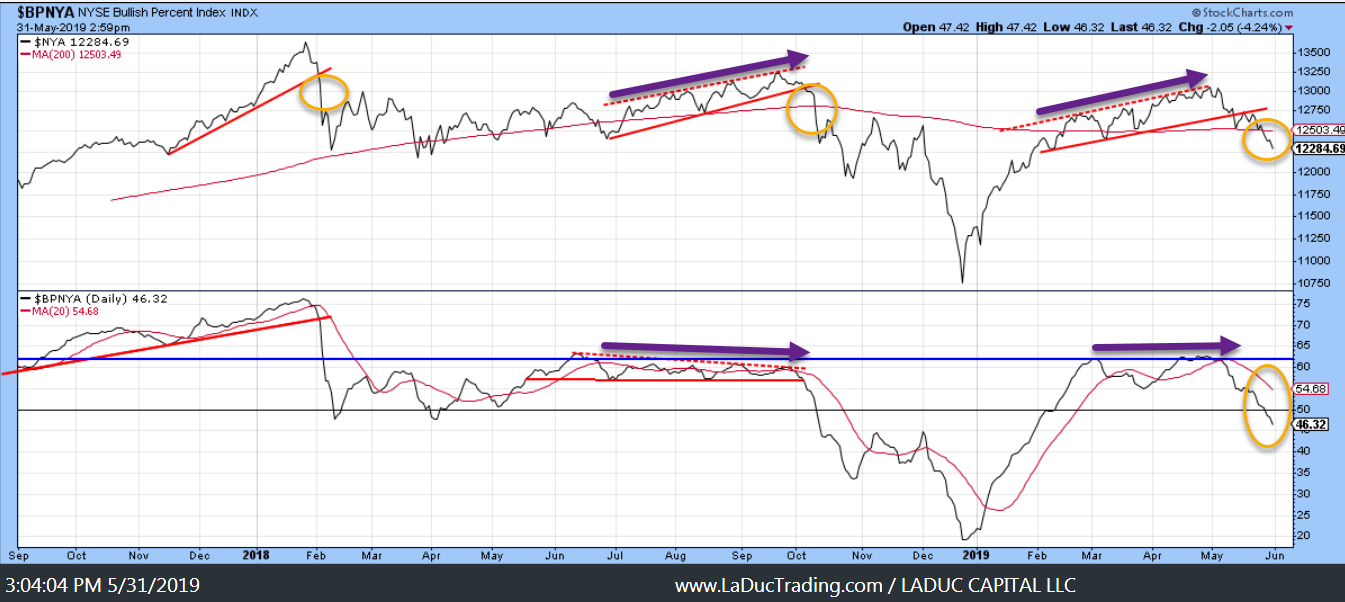
I am an unabashed bear – from Macro to Micro – once NYSE hit $13000, in part because these Intermarket Tells provided me the roadmap for when to enter and exit the past two years! None was a better tell for and gave me extreme confidence when we topped Jan 2018 (most overbought MACD in history of NYSE). In combination with other factors (like the rate of change of the 10 yr rate spike at the time), I was also strongly convicted when I called the Oct 3rd correction and then Dec 12th the Dec V-shaped rally. But man-oh-man did I get pushback on my most recent market timing call for a Trend Reversal at NYSE $13,000. And no, I had no idea Trump would declare Trade War on practically every trading partner we have! Well, I’m still bearish Intermediate-term and not even a June Rate Cut will change my mind – only price – and that means NYSE getting and staying above the red trend-line – but I don’t think it has much of a chance until the dotted white trend-line is tested at the least. Which means, it’s going to be a long summer…

Here is an updated, detailed look comparing NYA Composite with my fave indicator, Bullish Percent Index. Clearly breadth broke-down before price and now price has clearly caught up with the break-down narrative:
Fundamentals Confirm Breakdown

Macro Matters
While China tries to temper buying euphoria in its stock market – wherein Analysts Downgrade China’s Stocks at Fastest Clip Since 2011 via Bloomberg – US is throwing everything at its market to make it go up! While China is shutting down Bitcoin – as a way to keep Chinese Yuan from leaving/converting to US Dollars – US fiscal and monetary policies are working to deflate the USD against the growing demand by emerging markets for more USD! Samantha LaDuc
Top 5 Reasons To Be A Bull:
- Earnings growth, margin and profit contraction will trough in 1st half and recover in 2nd half.
- The Fed had promised 4 more hikes and and did a complete about face at the same time it plans to end their balance sheet run-off in September. Global yields are mostly negative which further incentivizes risk-on behavior.
- Global economic slowdown, notably in China, is now showing ‘green shoots’ that it may “bottom” soon.
- With light positioning in the market by institutional investors and fund managers, if economic data and FOMO price action continues, side-lined money could enter the markets, inducing a melt-up.
- An increase in money supply generally breeds complacency and greater liquidity.
So What’s The Bear Case?
- Earnings, Sales and Margins are slowing.
- Costs are rising but wages aren’t.
- Economic growth is slowing – worldwide.
- Event Risk – China Retaliation is a Big One, Yuan Devaluation; New NAFTA, Global Trade War, Brexit… remote but still: Saudi’s sell both equities and bonds… with China… – ha!… Stock Buybacks are banned – only half facetious.. [I wrote about this last August – What If – Price Discovery And Stock Buybacks ]
- Liquidity – it’s a problem. So what’s the proposed solution: Fed and White House are intonating rate cuts at the same time employment is under 4% and the stock market is near all-time highs. If the Fed does cut the Fed Funds Rate 50 basis points, many hope/expect it will be a 1999 redux – that this action alone will compensate from Trade Wars – that are currently being waged across the globe – and trigger inflation to pause our current ‘deflation problem” in oil / commodities from lower demand concerns – and result in a euphoric run up in asset prices (again) – regardless if they also fear that this will ‘end badly’…
Global Trends Are Not Our Friend
I recently wrote an article for See It Market – There’s A Lot Not Priced In – with key macro themes I believe are not priced into the market with a follow up article – Big Picture Trends. Here’s the quick summary:
- US Retail Slump and Credit Card Spending Slowdown
- US Auto Recession
- US Housing Sales and Construction Slowing
- US Trucking Slowdown
- US Earnings ‘Recession”
- US Highest Debt to GDP
- US Corporate Debt higher than 2008
- Germany’s PMI Manufacturing
- China’s PMI Manufacturing
- Eurozone Contraction
- Air Freight Slowdown / World Trade Volume Slowdown
- Global (Developed Market) PMI Slowdown
- All below 50.0: South Korea, Japan Taiwan Malaysia Russia Poland Turkey Czech Republic Italy Germany UK
As much as the Trade War can be attributed to slowdown in a number of key areas – World Trade Volumes that impact Freight and Manufacturing Slowdowns; Tariffs that can decrease Consumer Spending and contract Company Profits/Revenues – the Auto Industry weakness – the economic slowdown points to structural weakness in the US Economy that Trade Wars will compound – even if the stock market doesn’t know it yet, or worse, even if they expect Powell to save them.
My USD Triggers and Consequences
Here are the Top Five that hold my attention:
-
- Currency Trigger: Should China – by design or default – trigger a Yuan devaluation that rivals the August 2015 shock – $USDCNH can cause the USD to rise sharply and with it Volatility.
- Liquidity Trigger: The USD makes the weather but its ROC (rate of change) determines the severity. With that, a significant tailwind in a rising USD can trigger a short-covering in USD from EM panic. Why might EM panic? For the sheer fact that there is a shortage of USD they need to service their liabilities purchased in USD!
- Equities Trigger: Market weakness can prompt a safe haven run to USD (and Yen, but especially USD), which is actually a cruel closed loop for EM countries suffering from the above consequences of a strong USD!
- Interest Rate Trigger: Higher rates would impact the debt financing of both corporations and government, domestic and abroad, but higher rates are not an issue right now. However, the combo deal – of higher rates and USD – would cause a potential default and reset in our global financial system – a conversation we can revisit another time.
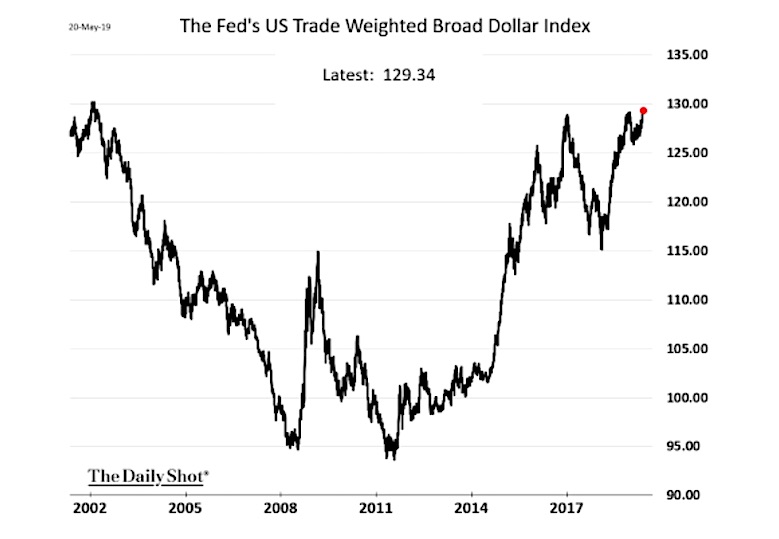
- Technical Trigger: The Fed’s Trade Weighted Real Broad Dollar Index is back to about its highest level since 2003 and global trade volumes are the lowest since the financial crisis.
A break, and we are probably into the next and most destructive phase of $ rally. – @RaoulGMI
What to Expect from NFP and the R-Word
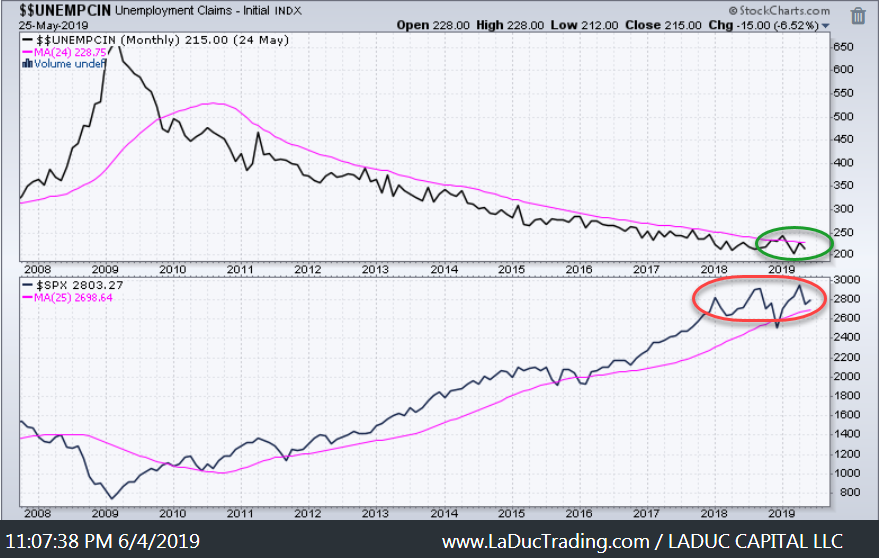
Non Farm Payrolls (NFP) are released Friday morning. Markets have had the mighty tailwind of ever decreasing employment rates and strong job gains during this past long cycle post Great Financial Crisis. Given all of the faltering, in some cases shocking, US and Global economic data signifying slowdown, NFP seems the last indicator of impenetrable strength that Wall Street and die-hard Bulls are hanging their hat on.
Problem is, we have had 9 months in a row of year over year increase in layoffs. In short, Layoffs have been climbing but not yet “showing up” in NFP and employment rates. Having said that, we’re close. It’s the last great lagging indicator to turn before Recession fears truly appear.
Recessions “cause” unemployment rate to go up, not the other way around (the UR is a lagging indicator)…employment works like this: H/T Liz Sonders
- Layoffs = leading leading indicator
- Unemployment claims = leading indicator
- Payrolls = coincident indicator
- Unemployment rate = lagging indicator
The average span between unemployment rate troughs and recession starts has been 6.4 months. However, here is a closer look at duration of peak SPY with trough unemployment. In 3 of the 5 times when US unemployment was at the current level, the S&P 500 peaked within 10 months. Well, the current unemployment rate has been at or <3.9% for 12 months already.
We have a “Goldilocks” market that can quickly turn into the Three Bears of “Layoffs, Unemployment Claims and Payrolls” chasing her out of the house!
What To Expect From Powell
Damned if he does and Damned if he doesn’t:
My Take: Powell is loathe to cut, but he is intonating Fed will cut! No less than 13 Fed Heads out this week preparing the stage and Powell acknowledging “Inflation Shortcomings” at his recent speech Monday night. Rate traders have already front-run this move. Higher USD has been defacto tightening. But here’s what I see – a case for a knee-jerk reaction higher ($2880 SPX for example), before a retreat lower with gusto.
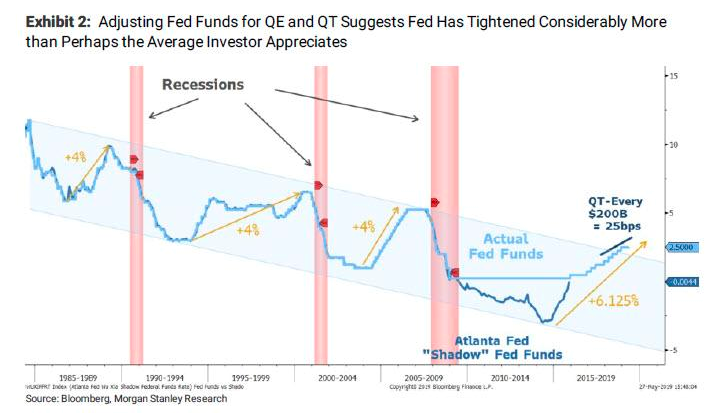
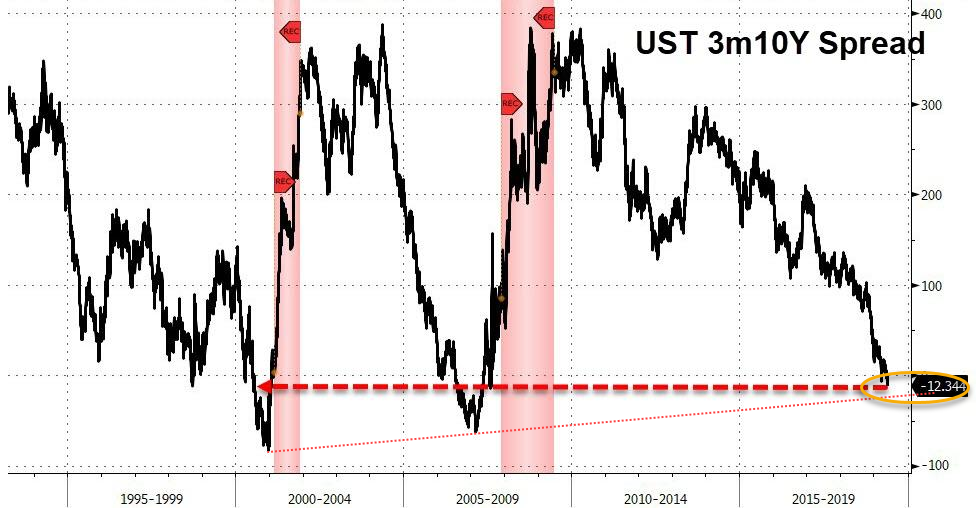
Most don’t expect that if Fed cuts the 10-year yields go UP not down – as market prices in “better economy” – steepening the yield curve. And … Here’s a friendly reminder of what can happen AFTER the Fed cuts: Recession. And judging from the ‘over-tightening’ implied (see chart below) compared to prior cycles, that may be why the bond market is aggressively leading the anticipated rate cut AND why both bond and equity markets are interpreting it as recessionary.
My Take: There’s a good chance market has an initial knee-jerk reaction higher ($2880 SPX for example), before a retreat lower with gusto. A big surprise in NFP may excite the bulls to buy equities on expectations the Fed will cut, but the diminishing returns of driving up assets on bad data and bad news is as safe as Goldilocks being chased out of the house as the Three Bears return home!
Treasury Volatility Is On The MOVE
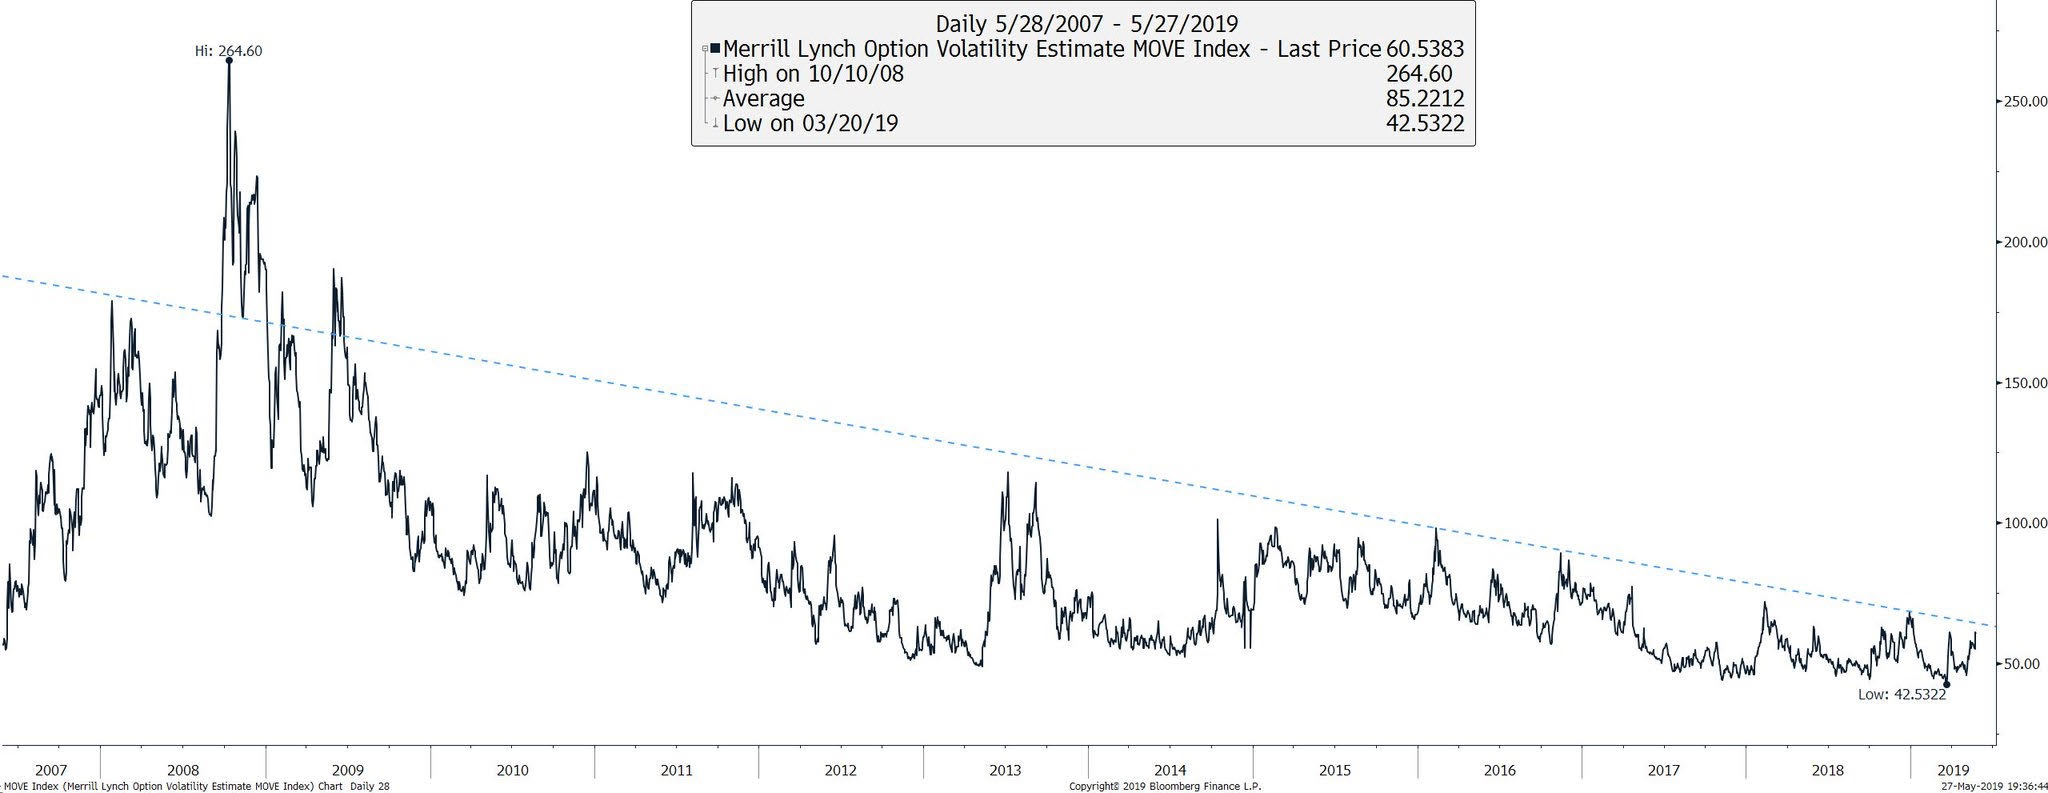
One theory I posted for it rise was based on Term Premium trading at a discount for 1st time in 50yrs and suggested that those who got caught selling volatility had to hedge by effectively going long Treasuries. Maybe this “Bond Convexity” was the reason for the recent 100bp move in the past 6 months. Looking back it is clear the treasury market was front-running risk of recession and/or future rate cuts. A break higher in MOVE would be quite market-moving – to the downside.
Credit Leads Equities
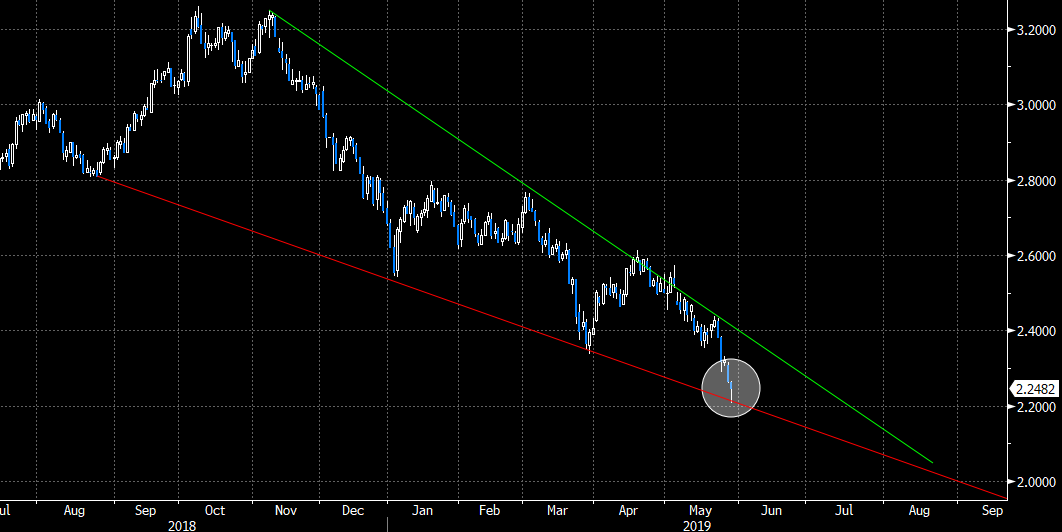
These moves in yields don’t look done – neither from the above Treasury Volatility MOVE chart (breaking up) or the following descending wedge on the 10-year (breaking out). After a suitable bounce off the red trend-line, I would suspect yields fall further this summer. The bond market is intonating 10-year rates are going lower to 2.0.
Bonds Triggered
Here’s my Tweet with chart of TLT May 9th – and posted chart: TLT had broken out, retested both 2015 support (blue) and 2019 trend-line (red dashed). Three weeks later, the 20 year Bond ETF has risen 6% – in one month!
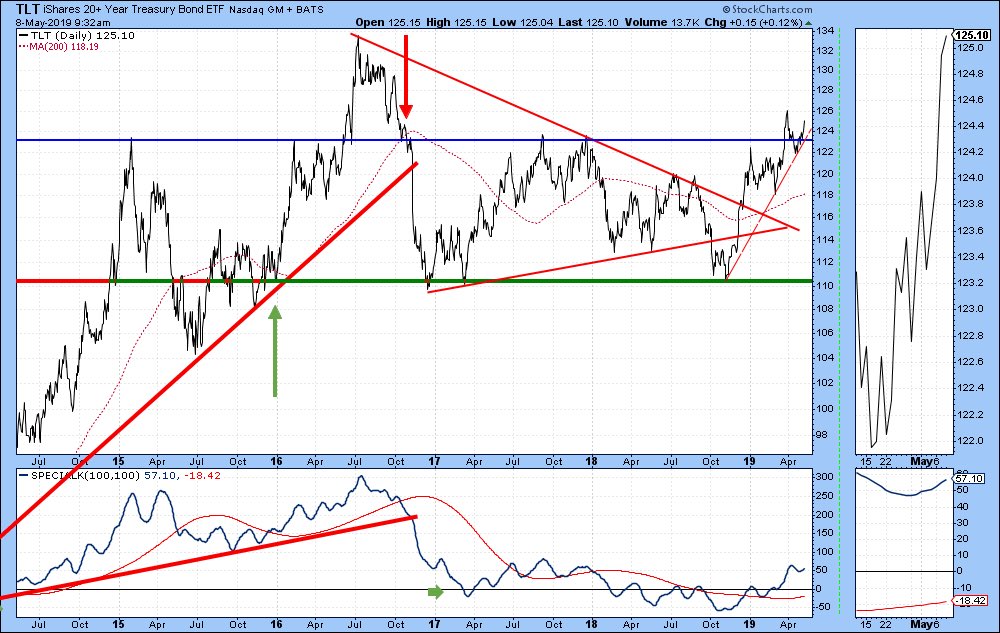
My “Macro-to-Micro” thesis aligned:
- Macro: This Global Carry Trade is a fully loaded freight train that will need a few miles before it can come to a stop let alone reverse.
- Micro: My Intermarket analysis confirmed strongly (bottom panel: indicator > 0 and > red line/MA).
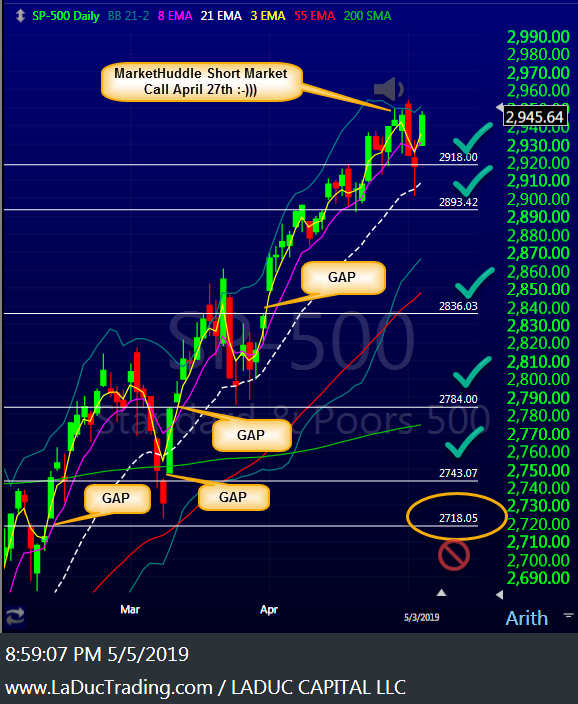
And with that I predicted that stocks would pullback and posted this chart May 5 as a road-map: We have filled 5 of the 6 gaps – $2718 still remains. Below that is risk of an Air Pocket that could kick in and trigger a Flash Crash (~40% chance). Otherwise, I predict we trade sideways-to-lower into 2020. My bear case price target for 2019 is $2277-2135.
Gold Skyrocketed. Why?
We have experienced a lot of disinflationary headwinds from the synchronized global slowdown and ultra loose monetary policies in the US, Europe and Asia specifically but globally in general. What could change these disinflationary headwinds into inflationary tailwinds as a result of or separate from the geopolitical events like US-China Trade Deal collapse and hard Brexit? The biggest one: the collapse of the US dollar as the global reserve currency. Am I expecting that any time soon? No. Given the whole wide world is awash in debt, we won’t likely see the World’s Reserve Currency of the USD until other countries start to liquidate their US Treasury holdings. And given the size of US market buyers – Blackrock et al – that supply would likely be absorbed. At least, we need to hope it will be. If not, there is NO safety in stocks or bonds. Everyone will buy Gold and every penny-stock gold mining shop will rise 1000 fold.
With that, the small USD pullback did not cause the recent violent move higher in Gold. It was just added fuel.
- Gold price divergence: price was stable/outperforming “industrial metals” like platinum and silver – this was bullish
- Both realized and implied volatility were at record lows.
- Macro backdrop distrusts Central Bank actions – or maybe more specifically their ability to act when they need to next.
- My BPGDX Index was extremely oversold.
- Gold usually trades down into an FOMC meeting, but as soon as market priced in rate cuts, Gold soared as USD pulled back and yields dropped hard.
Gold is a sometime currency, sometime hedge, sometime commodity and sometime store of value when other assets don’t seem to hold much value. When equities roll over, the safe haven of Gold (and Yen – we’ll talk about this next), take on renewed energy! And in this case, it was as simple as perceived rate cuts (lower real interest rates) are bullish for precious metals.
Yen Next?
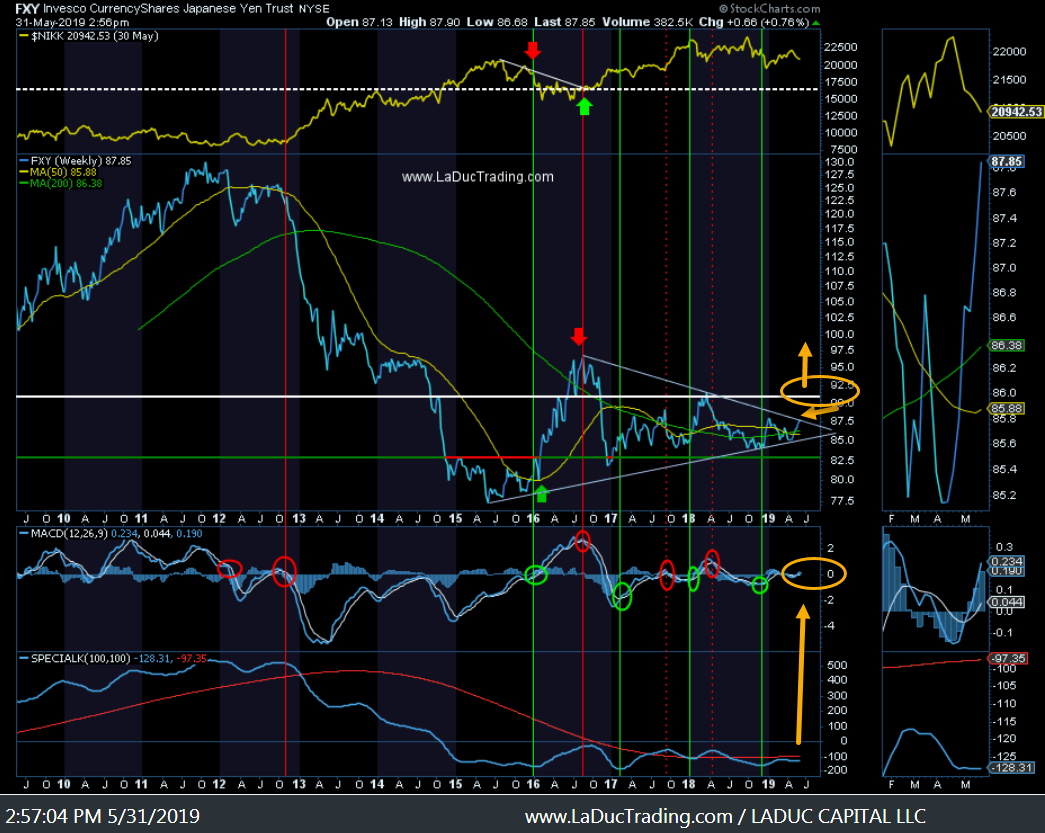
I have a thesis – way early – that the currency market is going to have a surprise this year … with a break out in JPY. Not only is Yen at its strongest in two years, but my Intermarket DXJ:XYJ ratio work has broken a 3 year-long pattern – to the upside. In Forex land, that looks ominous for USDJPY breaking $108 and revisiting that flash-crash price near $105.
Here’s what I’m looking at for levels in FXY :
Thank you VERY MUCH, Tyler for this interview/interest, your lovely introduction and most of all your time and sharing my Macro-To-Micro approach with your DailyFX audience!!
Samantha