Why Was I Short? What Did I See?
The following is a recap of my Intraday Trading off Headline-Risks Friday, along with some of my Intermarket Analysis leading up into the big sell-off that clients had in advance, plus an overview of my Macro Views that support more selling to come.
First, here is a quick review of client posts with my transition into bearish positioning and volatility warnings. The most recent was sent out Tuesday August 20th wherein I showed why I predicted a potential drop and by how much:
- How The Market Is Like Donkey Kong
- Intermarket Chart Attack: Trading Trend Reversals
- Intermarket Chart Attack: Some Things are Really Broken
- Gold At An Inflection Point
- Intermarket Chart Attack: Something Is Broken
I also posted publicly:
Here’s my warning for a market rollover: July 22nd.
“my breadth indicators (this is but one) are indicating the roll-over is just starting. The indices just don’t know it yet .” Samantha LaDuc
I updated with Market Thoughts: We Had The Rollover: August 6th.
“Big Volatility in Yield world gonna spill over to equities is my bet …” Samantha LaDuc
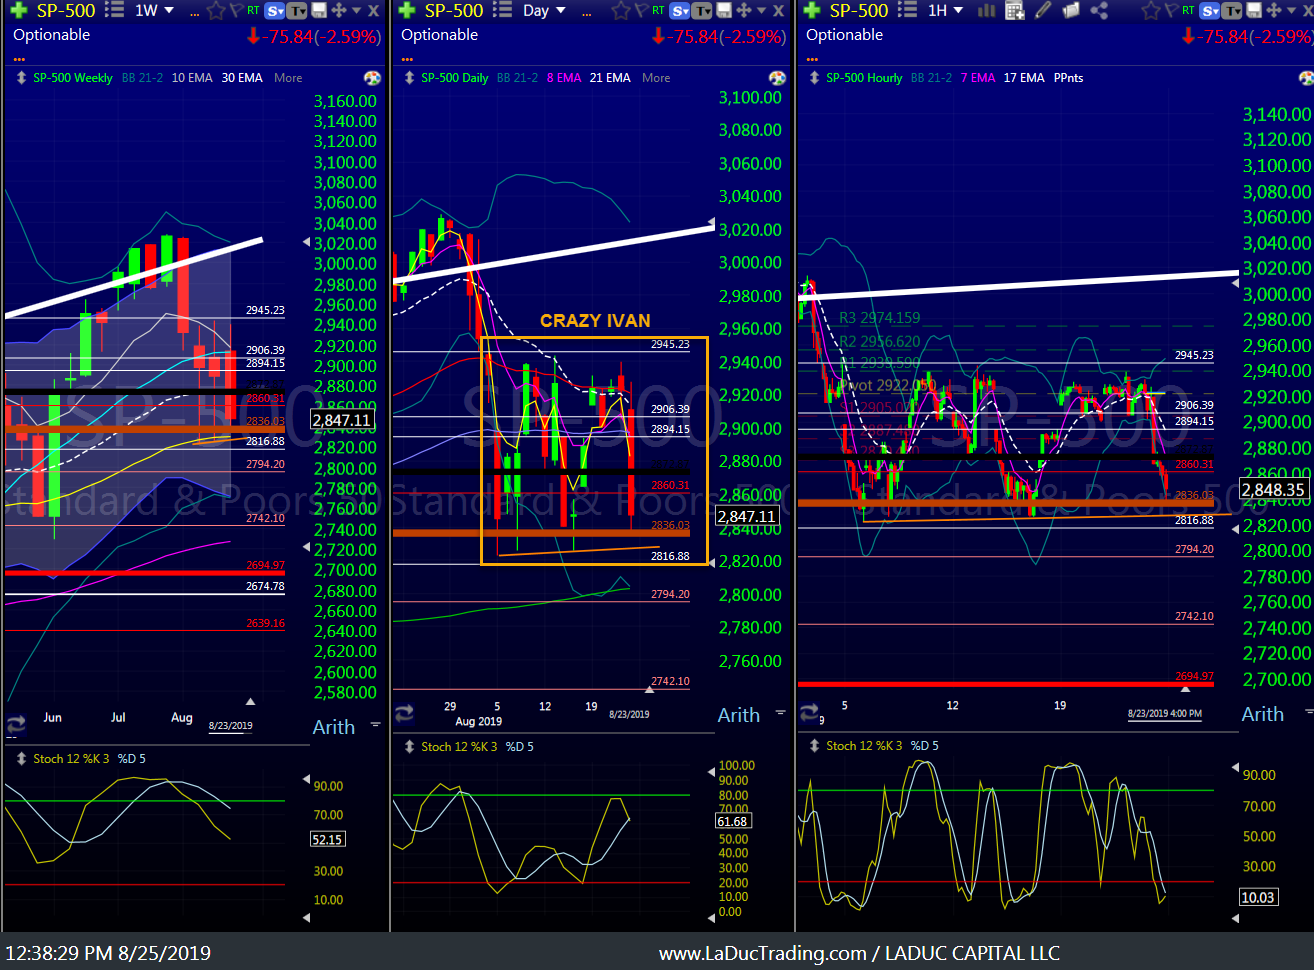
Well the price action in SPY has been nothing short of Crazy Ivan like – a theme I like to use whenever the chop is biding time until the drop – since Monday August 5th post FOMC and Trump’s displeasure with the FOMC when he was emboldened to escalate the trade war with China, as warned about June 19th for Marketwatch.
After his announcement August 1st of more Trade Tariffs on China (effective September 1st), SPY tested the 200D after hours on August 5th, and I have been warning that we would duplicate this tag of the 200D during regular market hours at a date in the not to distant future. Given Friday’s action, I’m fully expecting, and positioned, to expect it this week. If not, I will be caught off-sides. That’s the risk.
But trading the past three weeks has been high-risk. It was hard to hold longs OR shorts given the gyrations from ~$2822 to $2943. From my convictions, I reduced longs considerably (as discussed in a recent podcast), where I recently discussed migrating from equal-weighting of longs and shorts to positioning over-weight with shorts.
It worked out Friday – see total account value for the month to date – but I am heavily short now into Monday despite SPX closing/bouncing on support of $2847 (thick orange line) and having dropped 100 points in 24 hours. Below I will attempt to demonstrate WHY but first let’s review Friday’s main events before we look at my Intermarket chart interpretations and Macro views.
Friday Was “Eventful”
All eyes were focused on Powell’s speech to the Kansas City Fed’s annual symposium in Jackson Hole wherein he noted that events since the FOMC meeting have been eventful. But the trigger for the day did not come from Powell. His remarks were measured and dovish enough. The spark for the fire came from China and then Trump poured fuel on it.
A reminder for clients and non-clients alike, follow my Twitter account for my ‘small-bite’ macro insights and inflection-point warnings. It is best to be in my Live Trading Room, as I don’t tweet intra-day…unless there is a real risk-on or risk-off event. My intention for doing so is two-fold: Public Service but also so I can share some of my insights real-time with followers in hopes they convert to becoming trading room/trade alert/newsletter clients. On Friday, I was especially on point and prescient:
- 8:28AM – “China retaliation extends beyond Soybeans/Ag products. It’s now got its sights on US Energy market which is already fragile in credit land. $HYG $XLE”
- 8:33AM – (Based on RT: Due to time zone differences, China will be the first to impose tariffs on the US on Sept 1, at midnight Beijing time): “China will be first to impose tariffs? Baahaahaa Oh c’mon, you KNOW Trump’s ego in no way going to allow that! Look for tweet soon that he’s moving up the Sept 1 tariff date! Brace Yourselves! $VIX”
- 8:37AM – (Based on RT): New China tariff on U.S goods. This really tips the scale IMO to the negative side for risk assets. Not only does a full blown trade war slow consumption but it also raises inflation which potentially can handcuff the Fed from being aggressive on lowering rates. Stagflation.
- 10:24AM – (Based on Powell referencing 1995 in his Jackson Hole speech.) “IF this is Powell’s rulebook – aka 1995 – but he doesn’t want to say that directly, the market *should* be screaming higher. As IF China *knew* this was coming and announced their tariffs right before just to dampen the equities ramp. That was stealth, man. #PissingContest”
- 10:56AM – (Based on RT referencing trump/mnuchin USD intervention.) “Lower rates make it *seem* tech likes Powell and Trump’s tweet of potential USD intervention WILL HAVE unintended consequences… $USD/JPY breaking down is not bullish as it can send the Yen into escape velocity mode.”
- 11:01AM –
OUT OF THE POOL NOW!
In a Mama voice$VIX https://t.co/7pq8gJ3rYK
— Samantha LaDuc (@SamanthaLaDuc) August 23, 2019
-
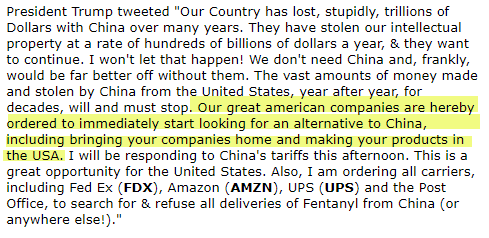
Here’s what Trump wrote that prompted my tweet – that will have FAR-REACHING implications:
- 12:02PM – “I gave you $USDJPY right before the drop. Now I call your attention to $HYG. #NotDone“
- 12:52PM – (Based on my “mama knows best” warning tweet.) “Btw: Ready for Round 2?“
- 3:09PM – (Based on RT from CCP mouthpiece that “US can’t find alternative market with China’s potential”.) “Why would China tweet that…NOW…with Dow down 573 pts…when they know the whole world is watching? To make Trump bite. And he did…he tweeted immediately after he just didn’t care. #Brinksmanship”
- 3:24PM – (Based on RT of morning tweet of warning that Trump would over-react with retaliation on China.) “See my morning tweet then have a look at the news: Just In: Trump considering 25% tariffs on all Chinese goods.”
My play-by-play analysis made my clients A LOT OF MONEY Friday in my Live Trading Room.
For Week Ending 8/23/2019:
- Chase: +49.39% ROI
- Swing: +17.44% ROI
- Trend: -1.08% ROI
By 9:35AM, I had trade alerts triggering short in: $BABA, $SMH, $AAPL, $BA, $GS, $AMZN, $NVDA and adding $GLD long (to my $GDX long).
Brokerage-Triggered Trade Alerts!
My Inter-market Chart Read
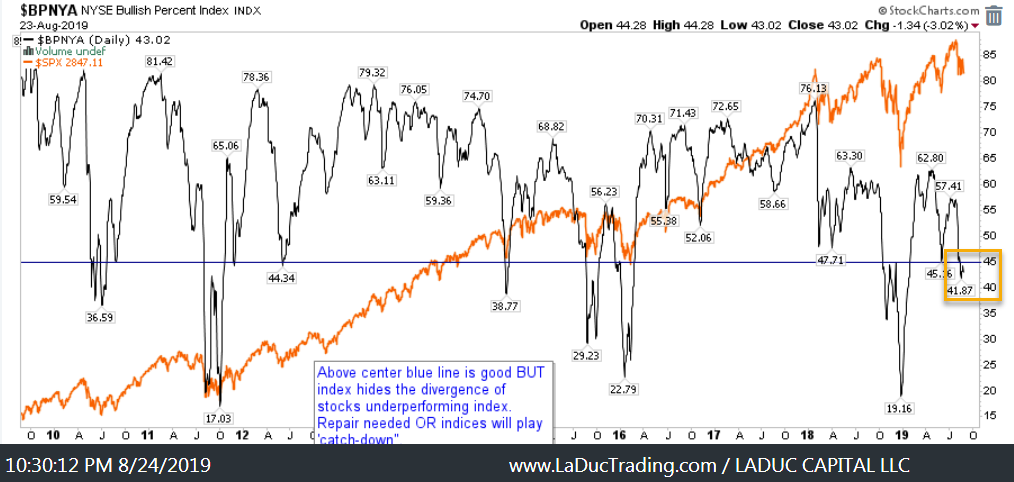
I shared this chart with clients Tuesday August 21st in my Live Trading Room and regularly share my Intermarket Analysis and Interpretation with clients so as to help them better position and protect themselves in this headline-driven market.
Clients know from my prior Intermarket Analysis posts that institutions sell when BPNYA drops <45. Further, it usually takes a double bottom before it reverses back up through 45 which is a much safer place to swing long.
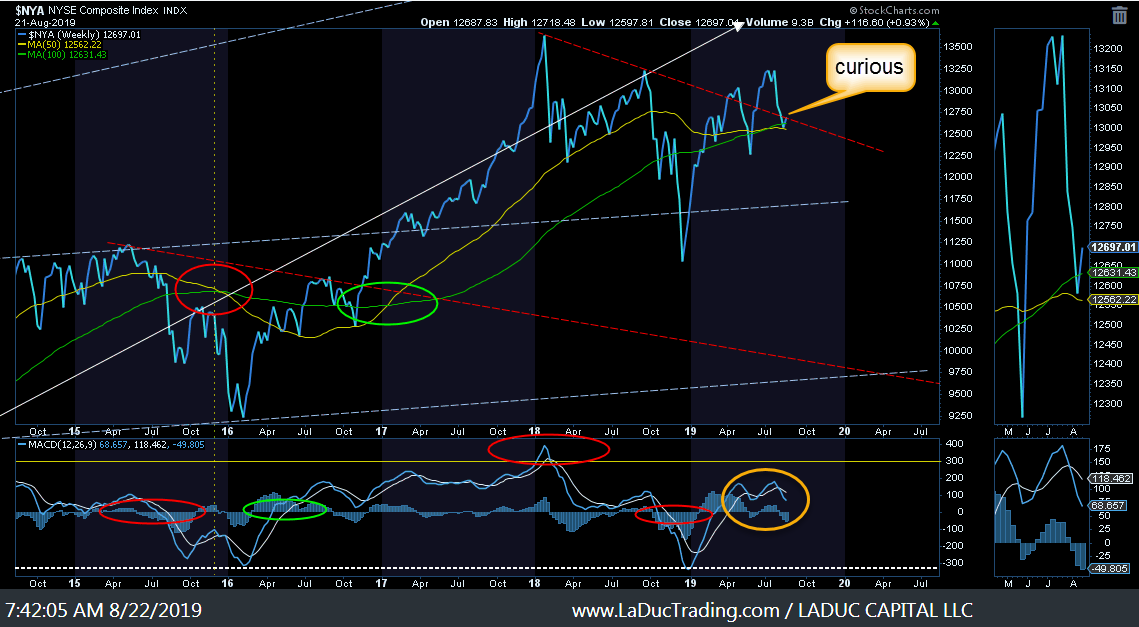
Subtleties in this NASI chart foretold weakness despite its oversold nature and Nasdaq price action. And still do…
- Oversold RSI hadn’t crossed > 30
- MACD hadn’t cross > 0
- Nasdaq price action (purple line) didn’t match the weakness of NASI at all.
- NASI had gapped below 0 line (purple circle)
- NASI expansion bars were larger than the price action of the underlying based on weekly close which indicated intraday volatility from ATR expansion was picking up.
- NASDAQ only -5% from ATH but NASI <0 and expanding to the downside and diverging against price action = likely roll-over.

Small caps had broken down below my talked-above wedge apex (red arrow) and had only succeeded in only rallying into the underside of the resistance line (~4 levels of support). The relational strength of small caps to large caps/SPX was weak as well (bottom panel).
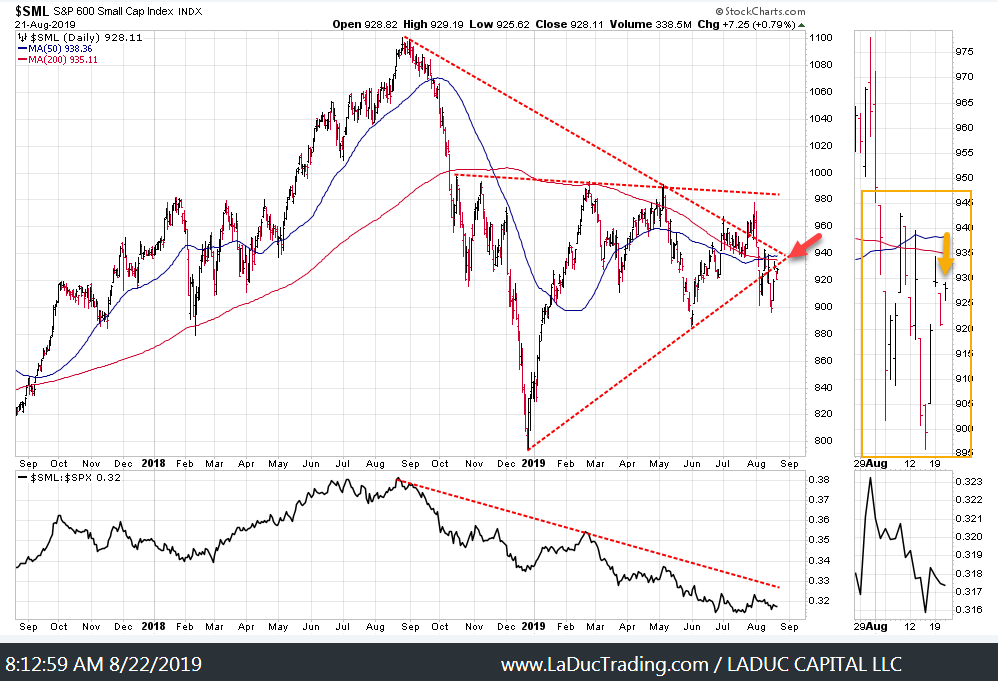
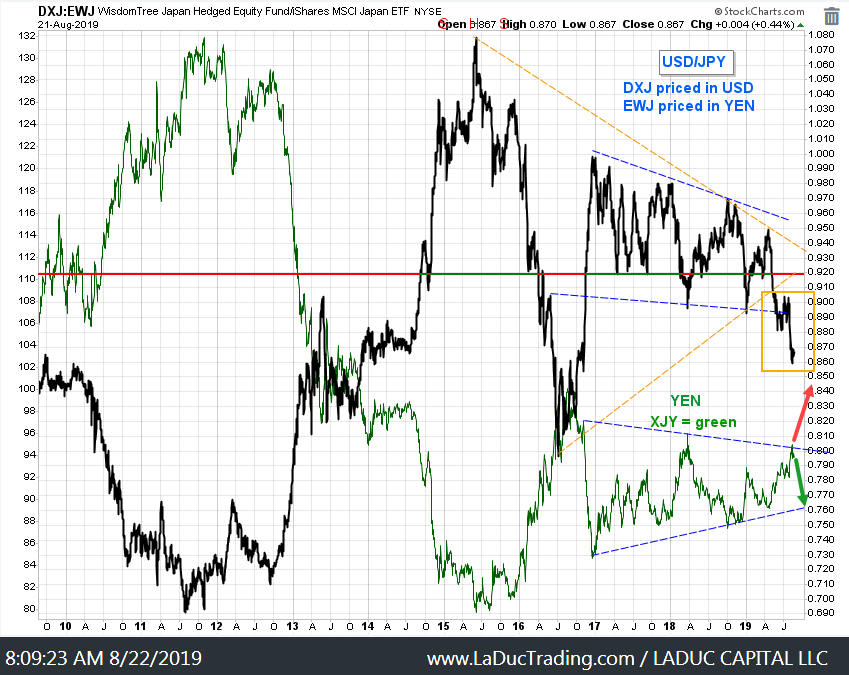
Risk-Off had already occurred with USDJPY breaking down from the wedge (blue dashed trend-line), with Yen looking like it wanted to go into escape velocity mode, as talked about since early June, along with the safe haven trade of Gold, Silver and Miners.
The above are just 5 charts that I monitor daily as part of my Macro-to-Micro analysis for clients. I use the discipline of Intermarket Analysis as a backdrop to spot divergences, breadth and depth of market internals, and for pattern recognition before bringing up a chart of the underlying asset from which to identify high-probability trade entries and exits. All the while, I am putting all of this technical interpretation against the backdrop of Macro
Macro Matters
FOMC on July 31st clearly didn’t signal or deliver the forward curve. Market wants a full 100 bps ‘in the bag’. Trump does too and has tweeted/said as such. With that, Fed really needed to make a sacrificial offering of 50 bps to avoid market’s and Trump’s wrath. They didn’t. I wrote about this for clients July 30th as part of My Macro View Next 6-12 Months.
Combine the Market/Trump reaction Friday with clear reports of global economic slowdown, add-in the assumption that a global slowdown would hit American shores, and the result is the US economy will deteriorate. Market has not priced this in. But now they might. I contend:
- Fed will continue to act ‘appropriately’ – as a result risk assets will suffer
- Trump will continue to ratchet up the Trade War – as a result risk assets will suffer
I have been chided for having a smart-sounding pessimistic argument that does not fully consider the bullish backdrop that has rewarded those who hold their nose and buy:
* Underfunded Pensions
* Stock Buybacks
* Private Equity
* Yield Differential
* TINA
I have an argument for each: Volatility Reprices Everything.