For context, I highly recommend reading my last Intermarket Chart Attack from November 22nd:
Intermarket Chart Attack: Where’s The Panic Buying?
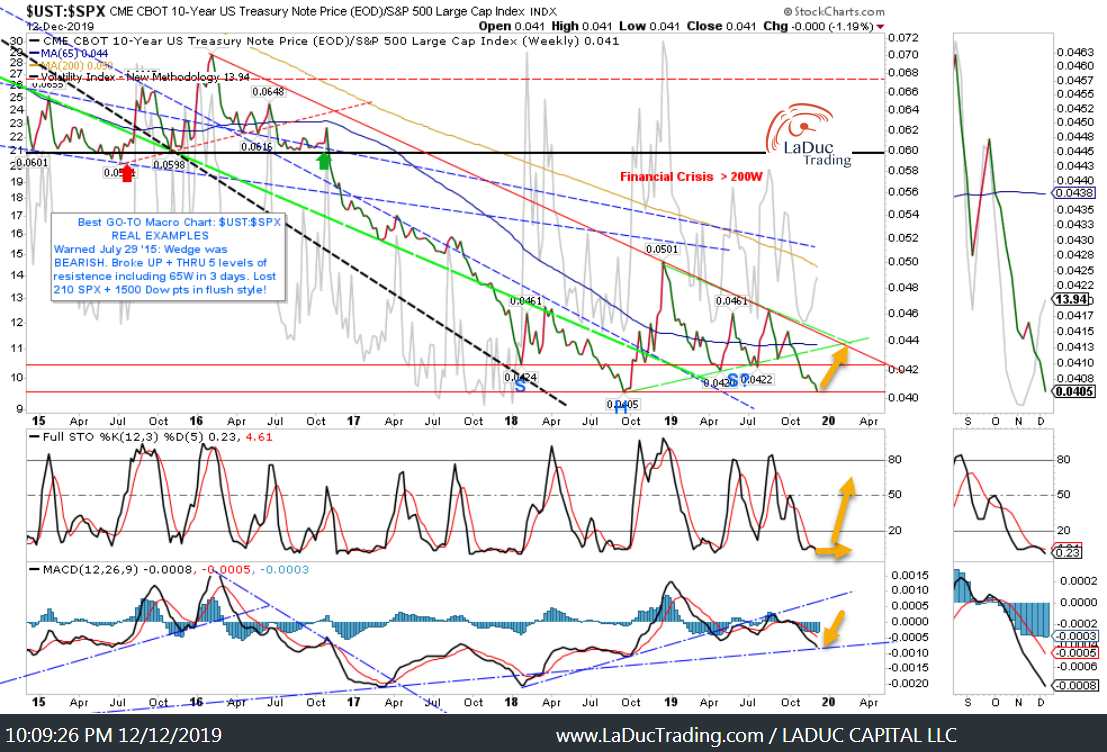
The bullish consensus SPY 2020 target is ~3,400 and given the recent slow grind higher, it might happen in the first quarter. Afterall, central banks the world over are coordinating the largest crisis intervention easing effort in history. Curious that we aren’t currently experiencing a crisis…
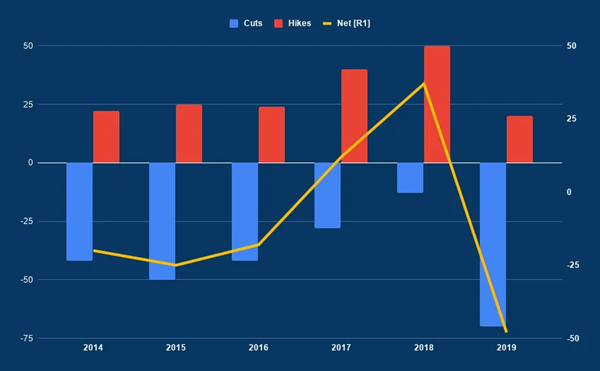
Plausible deniability is the theme as they persist in their accommodative lean even as growth picks up. Case in point, here are the net number of cuts – it is a spectacular effort this year which accounts for the markets’ outsized-gains, but is it sustainable?
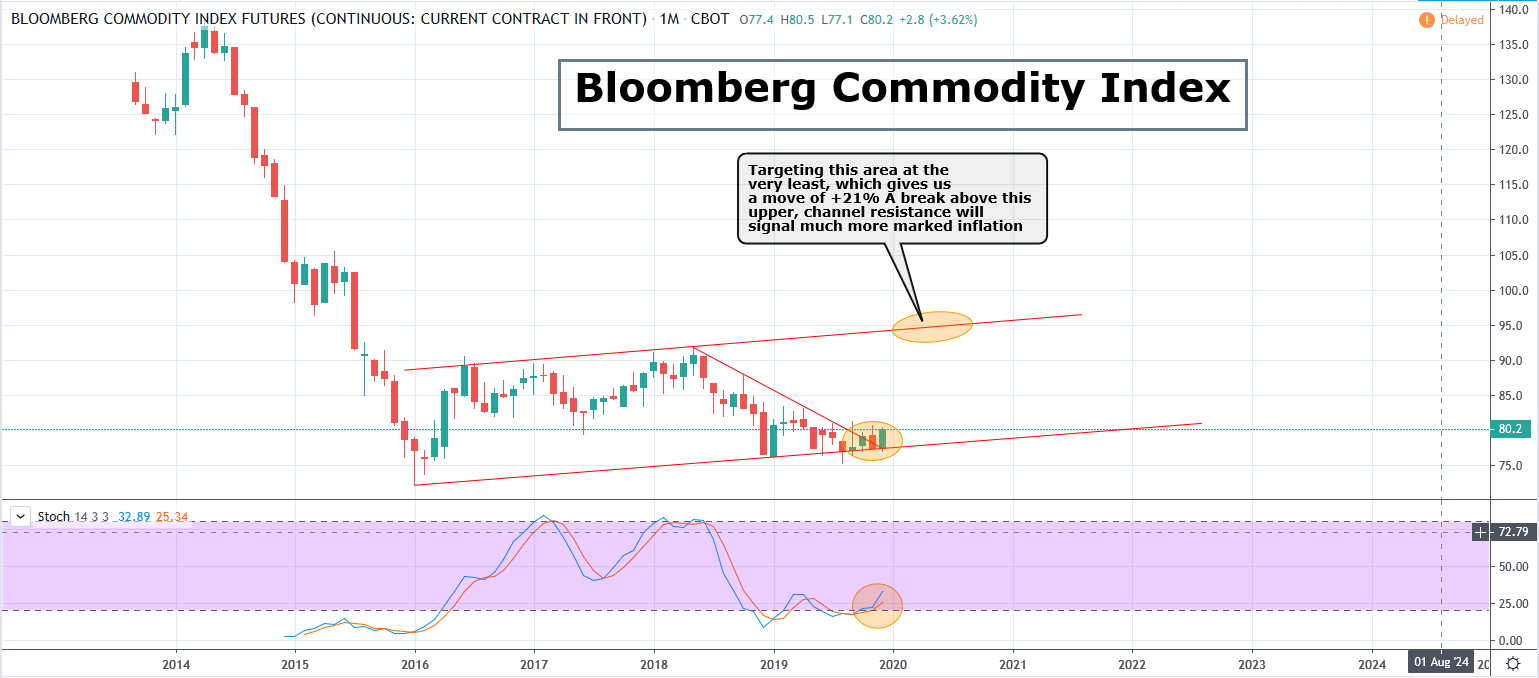
Inflation Returns
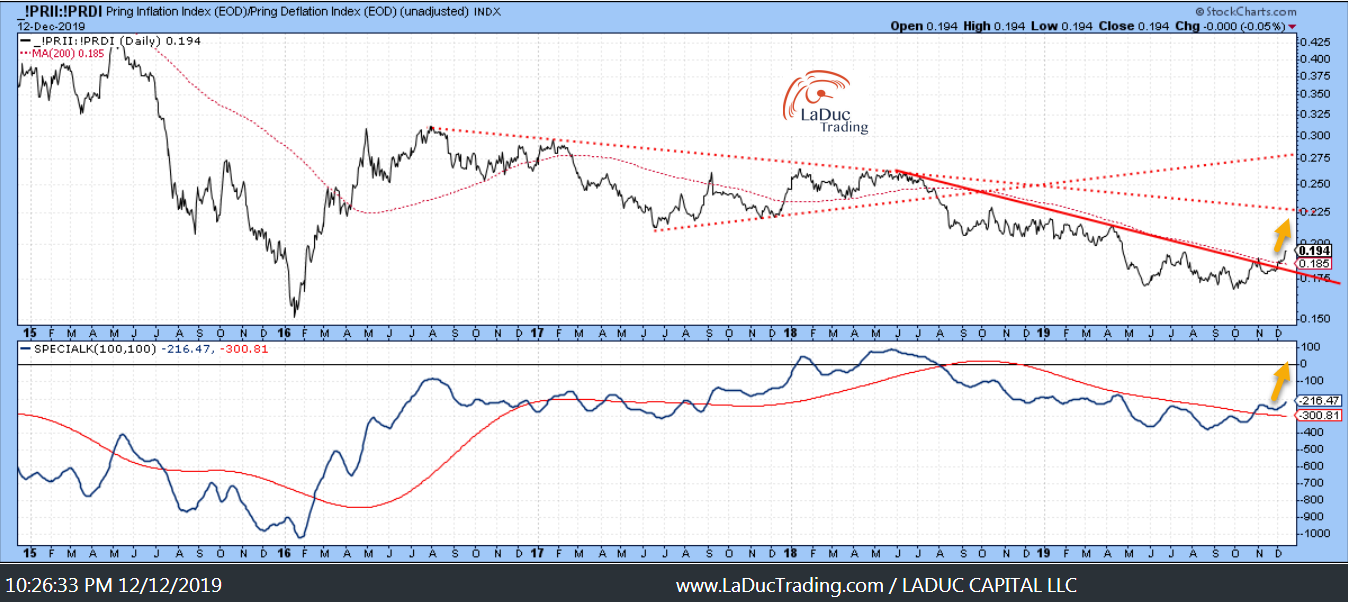
Martin Pring developed this indicator set to help identify trends in inflation. It’s ever so useful for trading the reflation trade in commodities…
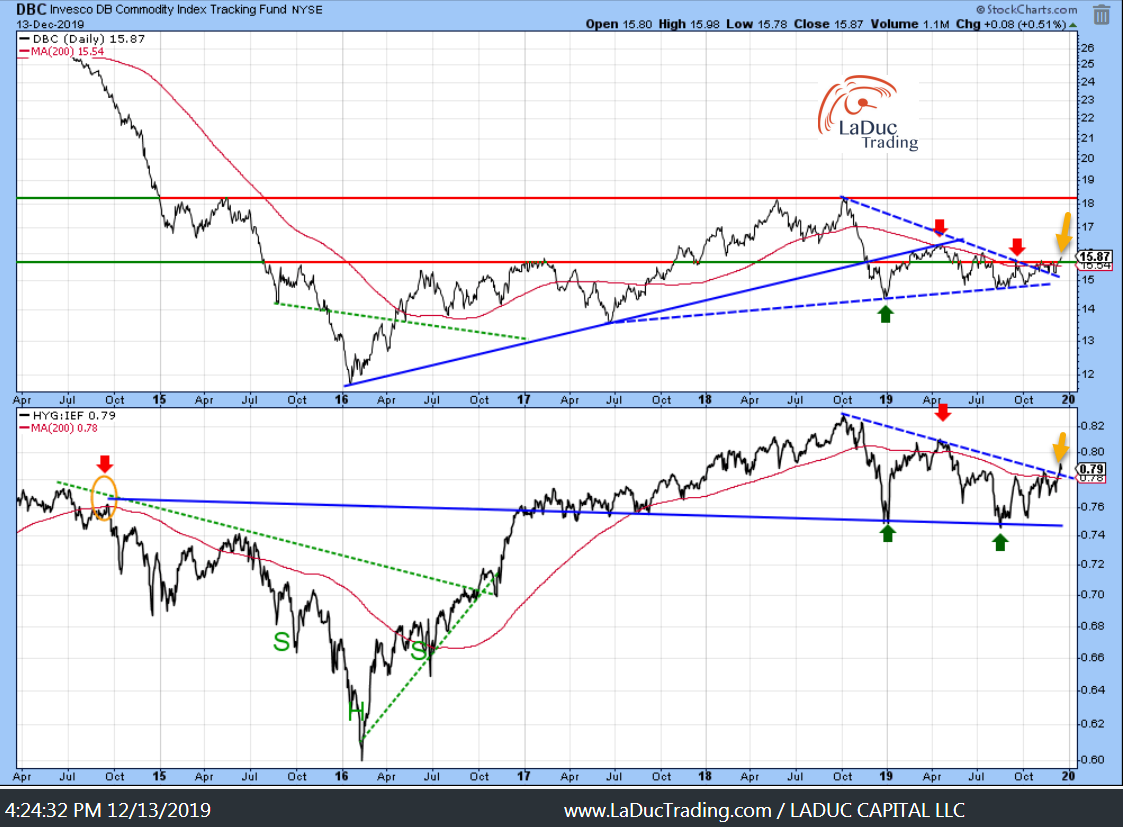
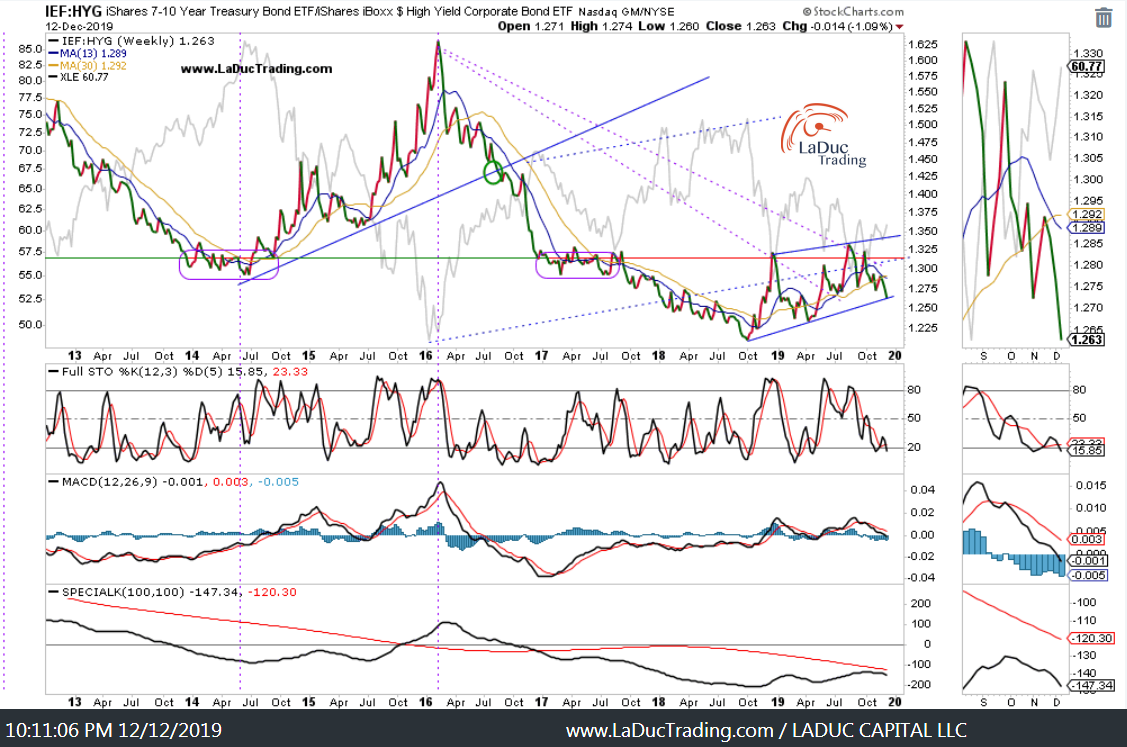
Another relative strength ratio I use (high yield corporate bonds versus treasuries) is indicating it’s time for inflation (and commodities) to break out as the DBC Commodity fund also shows we may be in early innings (yellow arrows):
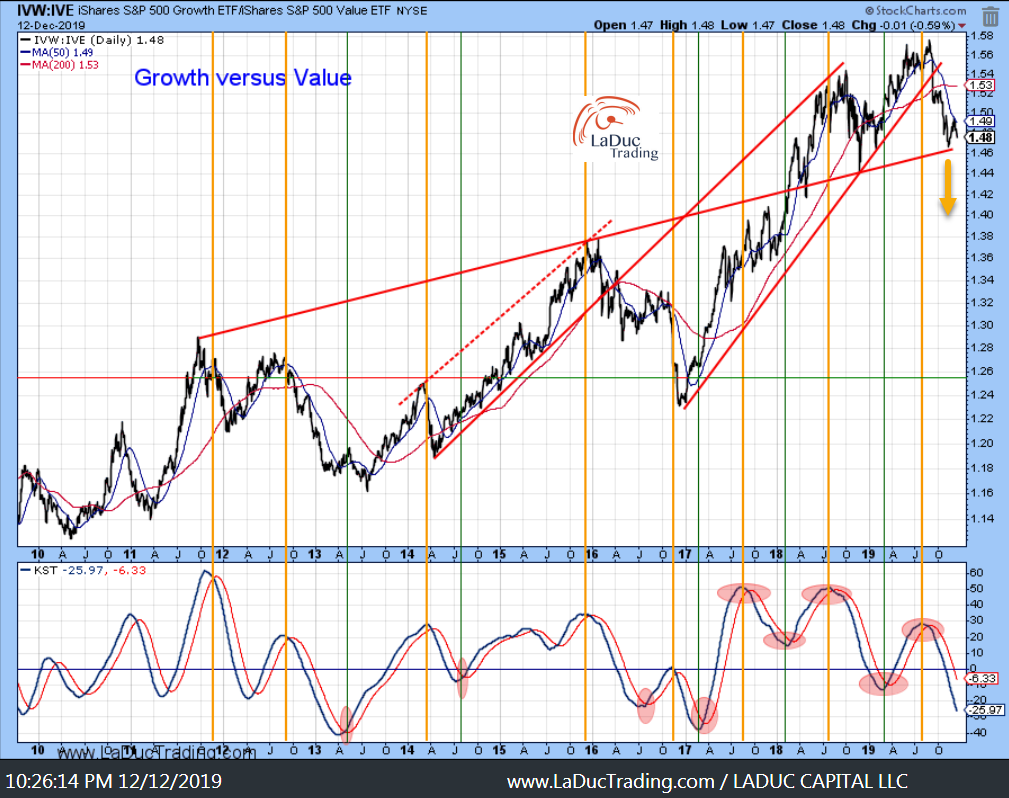
Should these oversold Commodity ‘value’ plays percolate up off the bottom, then it is logical that momentum stocks would pull back as rotation of money, well, rotates. With that, my High Beta/Low Volatility ratio indicates a regime change is underway. And check out the Momentum ratio (bottom panel) dropping lower after tagging the underside of the trend line:

I have written before that IF this red trend-line fails for this Growth:Value ratio, the market will be at the start of a correction as Momentum is sold off. And regular clients know my saying:
If they sell $AAPL and $MSFT, why buy anything else?
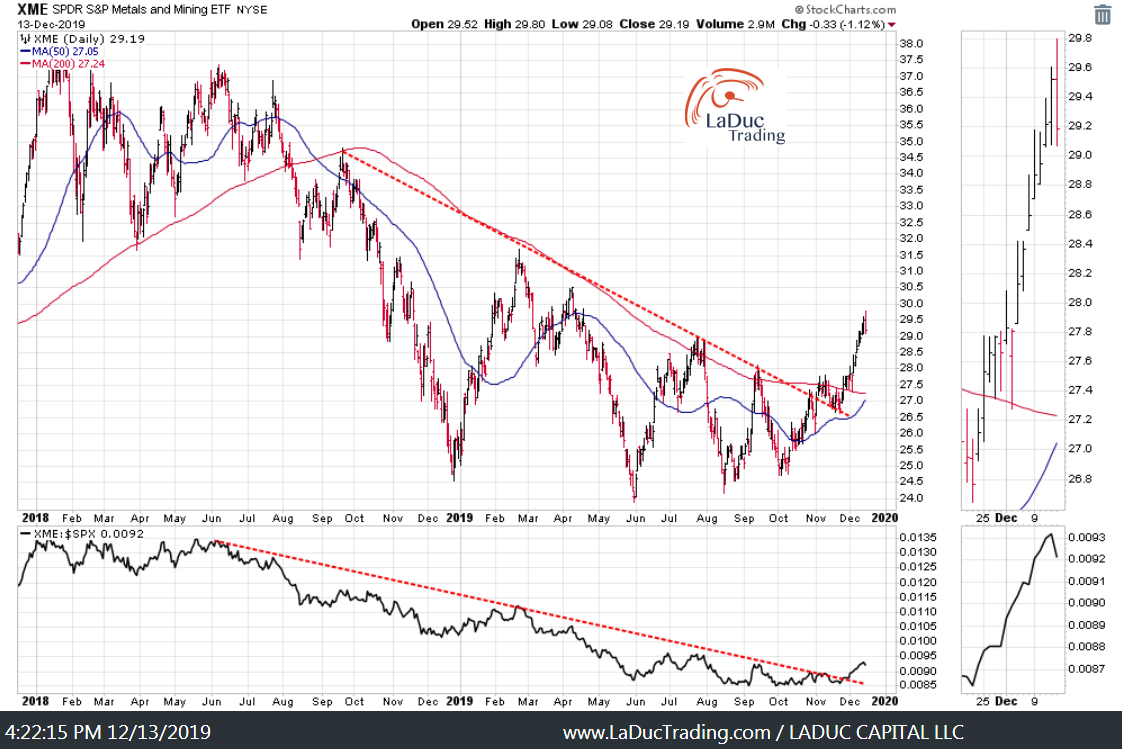
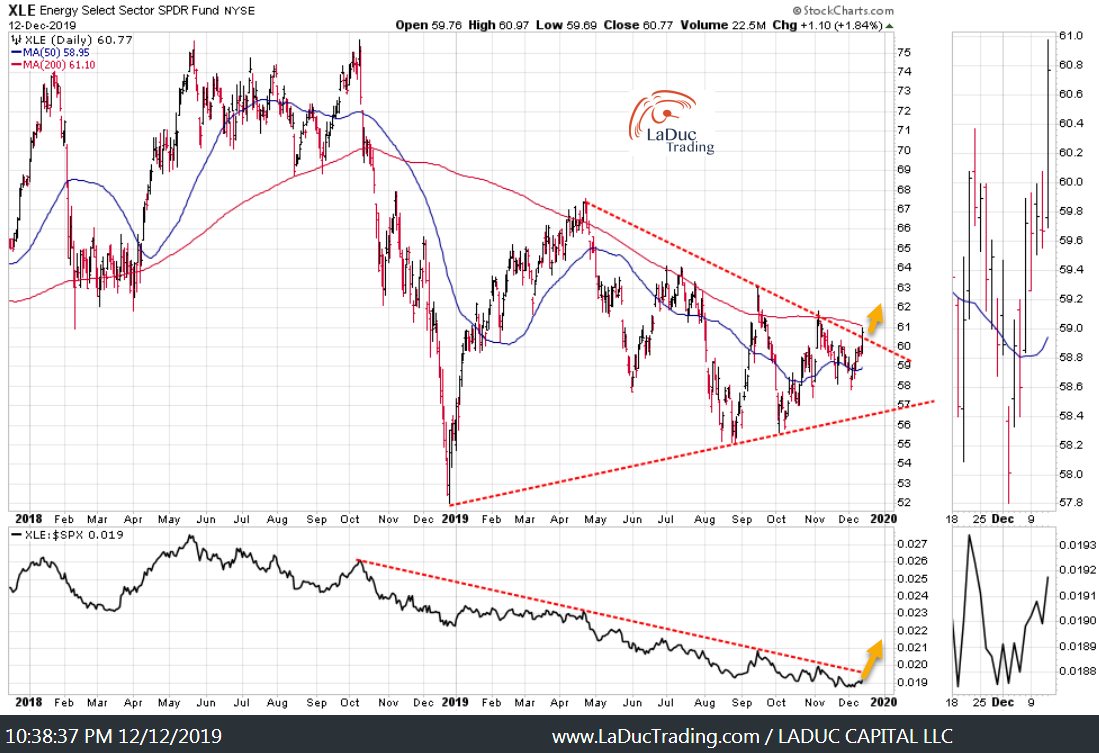
One of my favorite “Bottom Fishing” sectors for two months continues to show strength as Commodities rise such as Copper and Iron Ore:
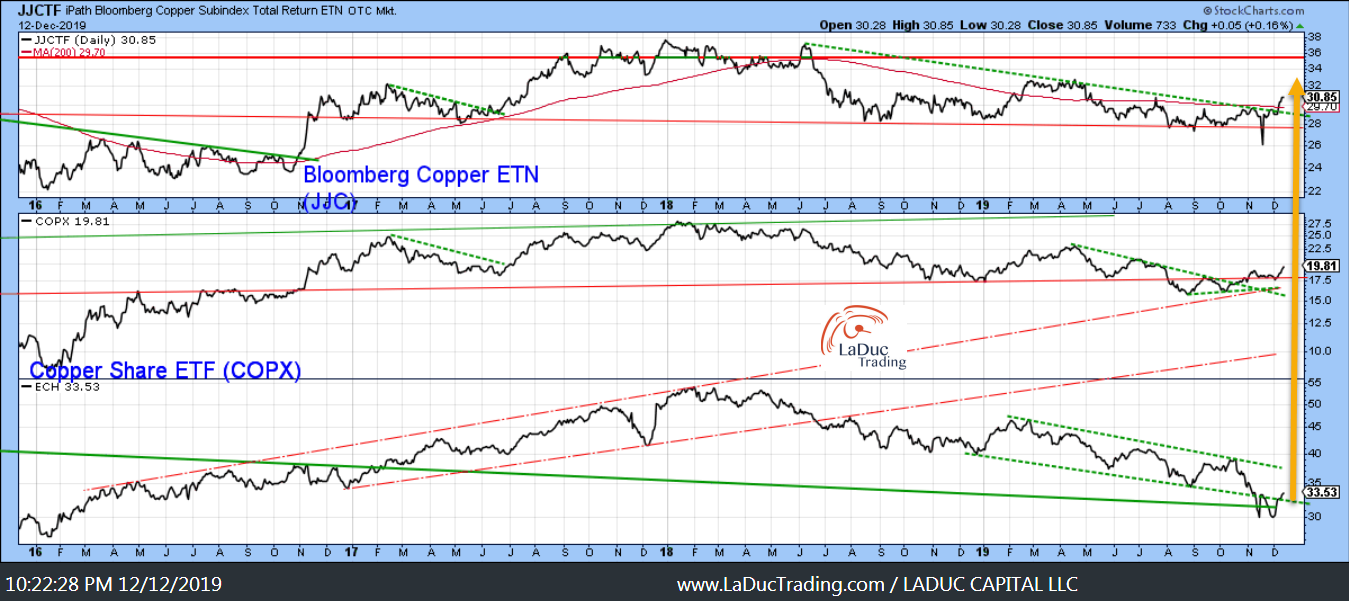
Copper continues to trade well as both a swing and trend-reversal set up long:
Oil and Gas plays continue to follows Oil’s rise before and after OPEC+ cuts, helped by seasonality and hedge fund positioning net long:
Hedge Funds raised net long Oil positions to equal largest 1-wk increase in 2 yrs. H/t @JKempEnergy
So now fund managers own 5.3 long positions for every short as OPEC+ cuts output to try and avert a build up in inventories next yr. tmsnrt.rs/2YPLHSM
Recall my Fishing Idea: AMLP as Investment Theme, sent Dec 4th The APR17 $8C suggested has tripled in 3 weeks, and it’s a bloody MLP!
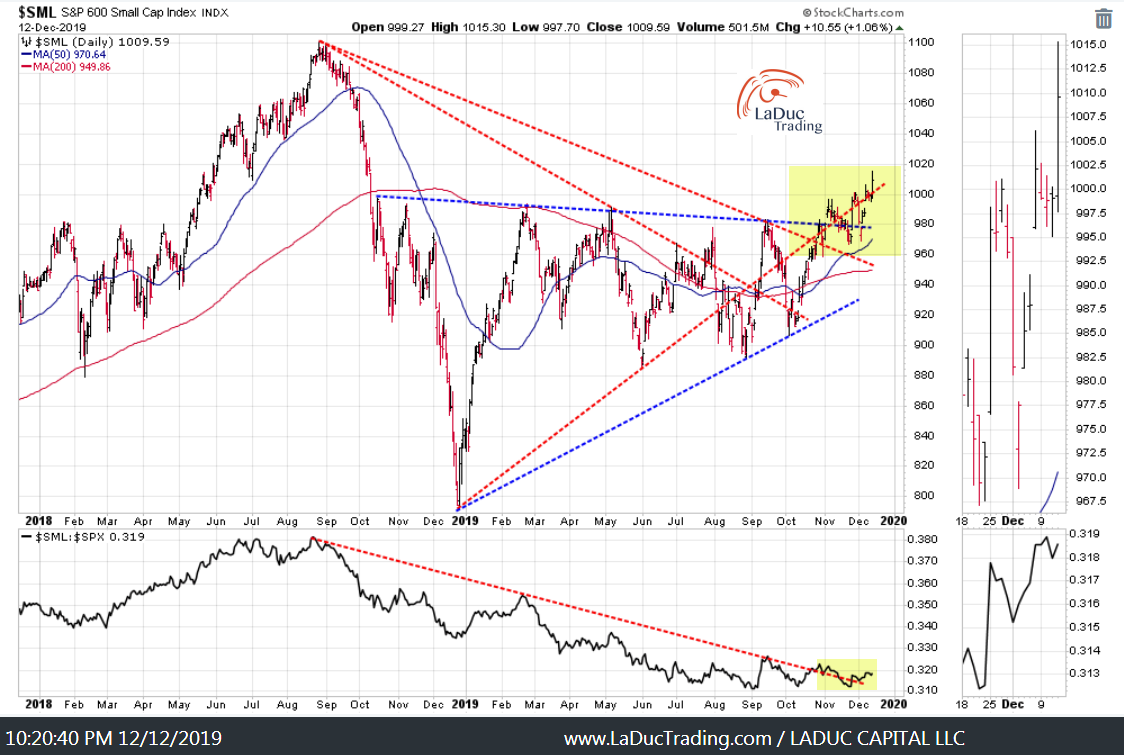
Small caps are not trading in a straight line but they are trading higher as presented here past two months:
Macro Matters
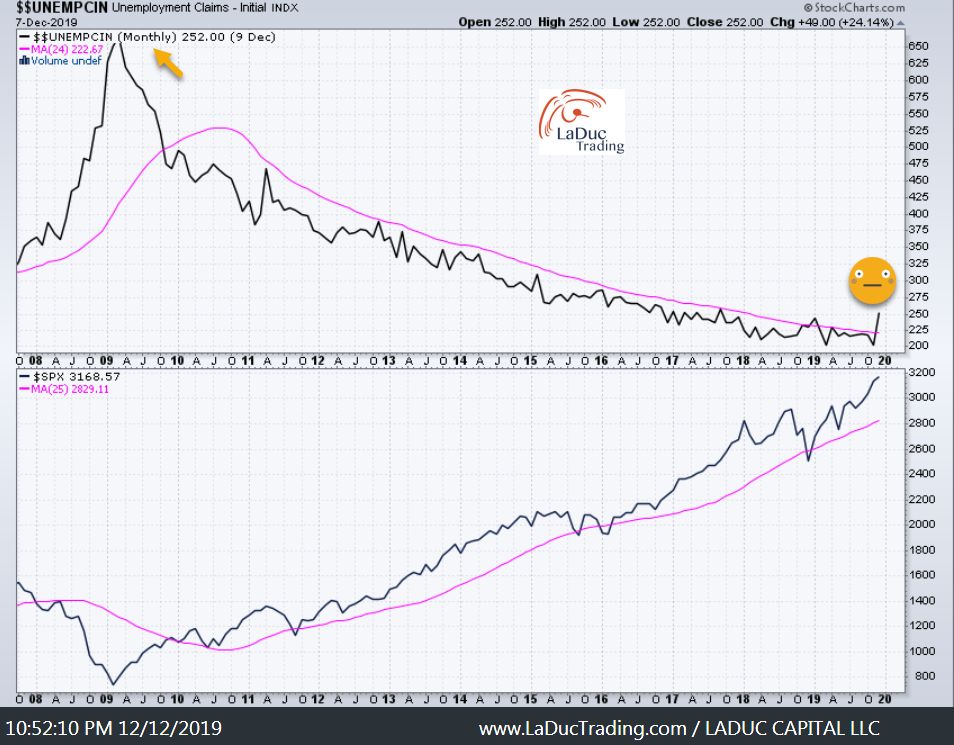
Jobless Claims reported last week were much higher than expected + Retail Sales released Monday were much lower than expected.
I track Unemployment Claims for purposes of visually identifying when inflection points are near – see chart. Add to this the macro backdrop of 500,000 jobs that represent a NEGATIVE adjustment we are going to see soon (prior year March 2018-2019 in Non-Farm Payrolls according to BLS). Come February, BLS will announce revisions. We could see the average job reports have been exaggerated by 40K jobs per month!
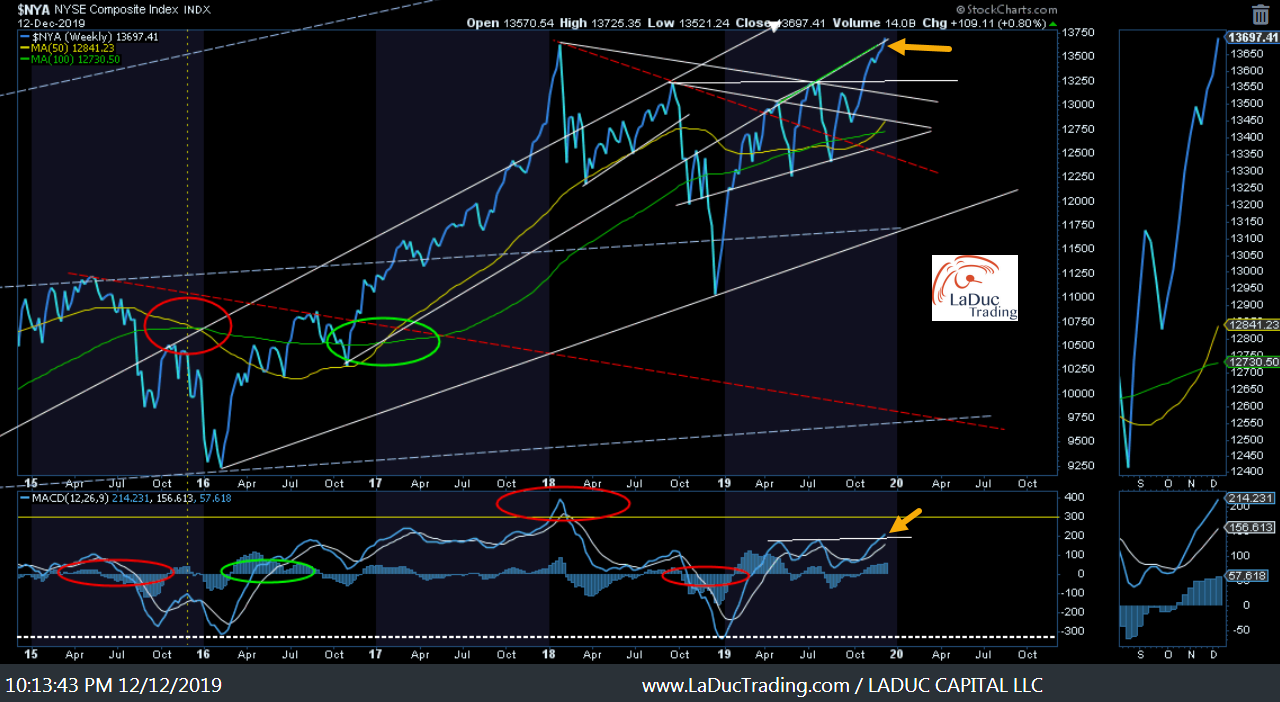
Market Prices may still be leading higher – so I’m trading more longs than shorts – but as we move into year-end, I expect the next two weeks of the year to have ‘jerky’ action with the strong potential for a sizable correction to start heading into Q1 2020, as written and warned about here.
I am particularly interested in this IEF:HYG ratio tag of trend-line support as a bounce in this ratio is akin to risk-off sentiment in market prices as treasuries get bid and high-yield corporate bonds get sold.
My Stock-Bond-Volatility ratio analysis is also in an area where sideways to higher is likely foretells volatility and volatility reprices everything: