This is an Intermarket Analysis chart review which graphically represent relationships (strong and weak) that can foretell how the undercurrents are moving to better identify where stocks/sectors/indices are flowing! You can see (and should see) my last Intermarket Chart Attack here.
Summer is here and with it comes Summer Trading – a condition notorious in August for record low volumes. It can also make directional option trading more treacherous as it is the perfect storm of illiquid option markets, low volatility and theta (time) decay. Most like to lighten up – both trading activity as well as positions – leading into a much busier and more dangerous part of the year: Fall. September typically brings back the big traders, macro moves and with it volatility and drawdowns. Best to rest up in August!
Make Hay While the Sun Shines
Earnings Season is in the home stretch after announcing results from Q2 2018, and although many companies reporting strong beats for the most part, and indices rising in kind, there are two glaring problems:
1. Bespoke sums it up best, “the percentage of companies raising guidance is down quite significantly” after 5 quarters of more raising than lowering.
2. The revenue Growth Rate is expected to decline 25.8% by Q4 2018 (year end) and decline 42% between Q3 2018 and Q2 2019.
The coming weakness in both revenues and earnings will weigh on stocks this Fall while stock buy-backs will buoy them up. It’s an auction of buyers and sellers and since the downdraft in February, markets are grinding but not breaking up or down decisively. But at some point, one side will tire and markets will have out-sized moves. For market-moving events in the Fall that could trigger big moves, here is my list:
My Macro Top 10 Risks for 2018
Monetary Risks –
- Yuan Devaluation spikes USD (Trade War Retaliation)
- BOJ Unpegging (September meeting/Response to China = Yield Spike Globally)
- China Gold Monetization of Oil futures contracts in Yuan (slated to begin in Sept/Oct, potential panic selling of USD end of year)
Growth Risks –
- Earnings Peak (FANG Top, trade war impact,)
- Eurozone Peak (softer economic data, tariff impact, Brexit)
- Housing Peak (higher input costs, inflation and rates stifle demand and loan supply)
Political Risks –
- Mid-term Elections (party/politics lead policies)
- Mueller (aka Trump trouble/repurcussions)
- US Government Shutdown (Trump threat for immigration control – aka The Wall)
- Iran Sanctions (Trump threatens to stop doing business with any country doing business with Iran – think EU and China trade – Nov)
Price Discovery and Stock Buybacks
I could write paragraphs about each of my Top 10 Risks for 2018 but there is one that I don’t think is on radar with many (as it is not correlated tightly to Monetary or Fiscal policies). Still, I have been thinking about it a lot of late as I watch the market unable to turn down with any staying power. Could it be Stock Buybacks? None of the other Macro Risks – from political mis-steps or monetary tightening or currency/trade war positioning – has seemed to deter the Buy-The-Dip crowd. So I decided to have a closer look into this US phenomenon of corporate stock buybacks and how they mask a potentially large blind spot in the investing public.
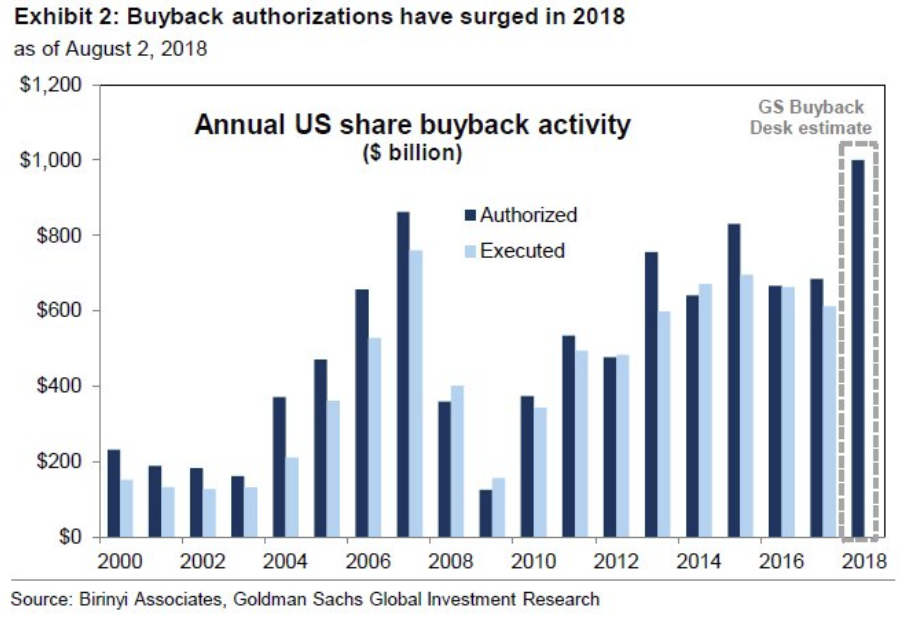
Buybacks have been essential fuel for the low-volatility regime, enabling steady equity appreciation and in turn, the rules-based strategies pegged to that tranquility. Now, as volatility returns to equity markets, buybacks will likely prove key to understanding and anticipating the threat of a high-volatility crash.
Buybacks for 2018 are expected to reach a fever pitch – to a record $1 Trillion, a 46% rise from last year – thanks to tax cuts and repatriation. Add to that, corporate cash is being channeled back into leveraged credit, resulting in five times the equity buybacks. A type of ‘closed loop’ system that requires a major upset to break the loop- say like Regulation.
So when I see these types of charts, I ask myself questions like, “It it wasn’t for AAPL buybacks, would they really be a $1T company?” We can debate it all we want, and yes, I firmly believe AAPL is a great company but with slowing growth. Instinctively I just know it could not be ‘this high’ without the Closed Loop of Stock Buybacks. And then I found this chart:
Apple's buybacks have spurred about 42% of the stock's gain since 2013, via @TheOneDave pic.twitter.com/uSXjv01Rvh
— Lisa Abramowicz (@lisaabramowicz1) August 1, 2018
Another ‘closed loop’ system is more insiduous: A study found that in 2017 and early 2018, the percentage of insiders selling stock more than doubled immediately after buyback announcements. CEOs are cashing out as they announce stock buybacks that buoy the stock price higher.
This is just another version of my “Sold To You” mantra of late: Insider Selling.
The later stages of the 2009–2017 bull market are a valuation illusion built on share buyback alchemy… Share buybacks are a major contributor to the low volatility regime because a large price insensitive buyer is always ready to purchase the market on weakness… Rising corporate debt levels and higher interest rates are a catalyst for slowing down the $500-$800 billion in annual share buybacks artificially supporting markets and suppressing volatility.
Artemis Capital
I am reminded of the last few chapters of Reminiscences of a Stock Operator wherein Jesse Livermore’s character details the the difference between stock Speculation and Manipulation – both of which he was privy to. His last chapter is a call to ban/remove stock buybacks from The Exchanges. Color me skeptical, and maybe it’s just the timing of all these analytical touch points – like the 100 yr insights by a master trader that resonate, the foreboding macro backdrop which is seemingly ignored, incessant buying of any dip, the growing inequality from monetary and fiscal policies – but I came to wonder what would happen if stock buybacks – $1T slated for 2018 alone – were removed. What would price discovery look like then.
Add to this the fact that the richest 10% of Americans own about 80% of all shares of stock (the top 1% owns about 40%), and you get a broader picture of how and why inequality has widened so dramatically. Robert Reich
Then my mind wonders further. If we didn’t have pervasive financial engineering in the form of corporate buybacks, would profits actually find their way into wages as a way to help resolve the glaring inequality gaps? Yes, it would cause the ubiquitous wage inflation that so many analysts and economists have feared/talked about, but it would also lift up the standard of living that could in turn spur more sustainable consumption and real economic growth.
How much might workers have benefited if companies had devoted their financial resources to them rather than to shareholders? Lowe’s, CVS, and Home Depot could have provided each of their workers a raise of $18,000 a year, the report found. Starbucks could have given each of its employees $7,000 a year, and McDonald’s could have given $4,000 to each of its nearly 2 million employees. National Employment Law Project and the Roosevelt Institute
The report is careful not to draw a causal relationship between stagnant worker pay and rising buybacks. I’m calling that out. The report examines the period just before President Donald Trump’s $1.5 trillion tax cut came into effect and the tax legislation that cut both the top marginal corporate tax rate from 35 to 21 percent—dropping the estimated effective tax rate on profitable businesses to just 9 percent. I’ll leave it to a future report to update these figures.
So here we are. Big Picture 1st Half 2018 Review reveals the following cracks: Wage growth has been slowing. Construction has been slowing. Jobs added has been slowing. Auto sales have been slowing. Home sales have been slowing. Home prices have been declining. But these things are clearly rising: Inflation, Deficits and Buybacks.
Buybacks are a byproduct of our markets since 1982, and with so much cheap debt and excess cash, it makes sense that companies that can take advantage of my buybacks, do! But at what cost? Income Equality and Price Discovery are collateral damage and nothing is going to change that until new policies are created to change that.
And with that, back to my Serious Question: What would happen if stock buybacks – $1 T slated for the Top Ten stocks in 2018, out of a $23 T stock market capitalization for 2000 equities in the NYSE – were removed? What would price discovery for our markets look like then!?
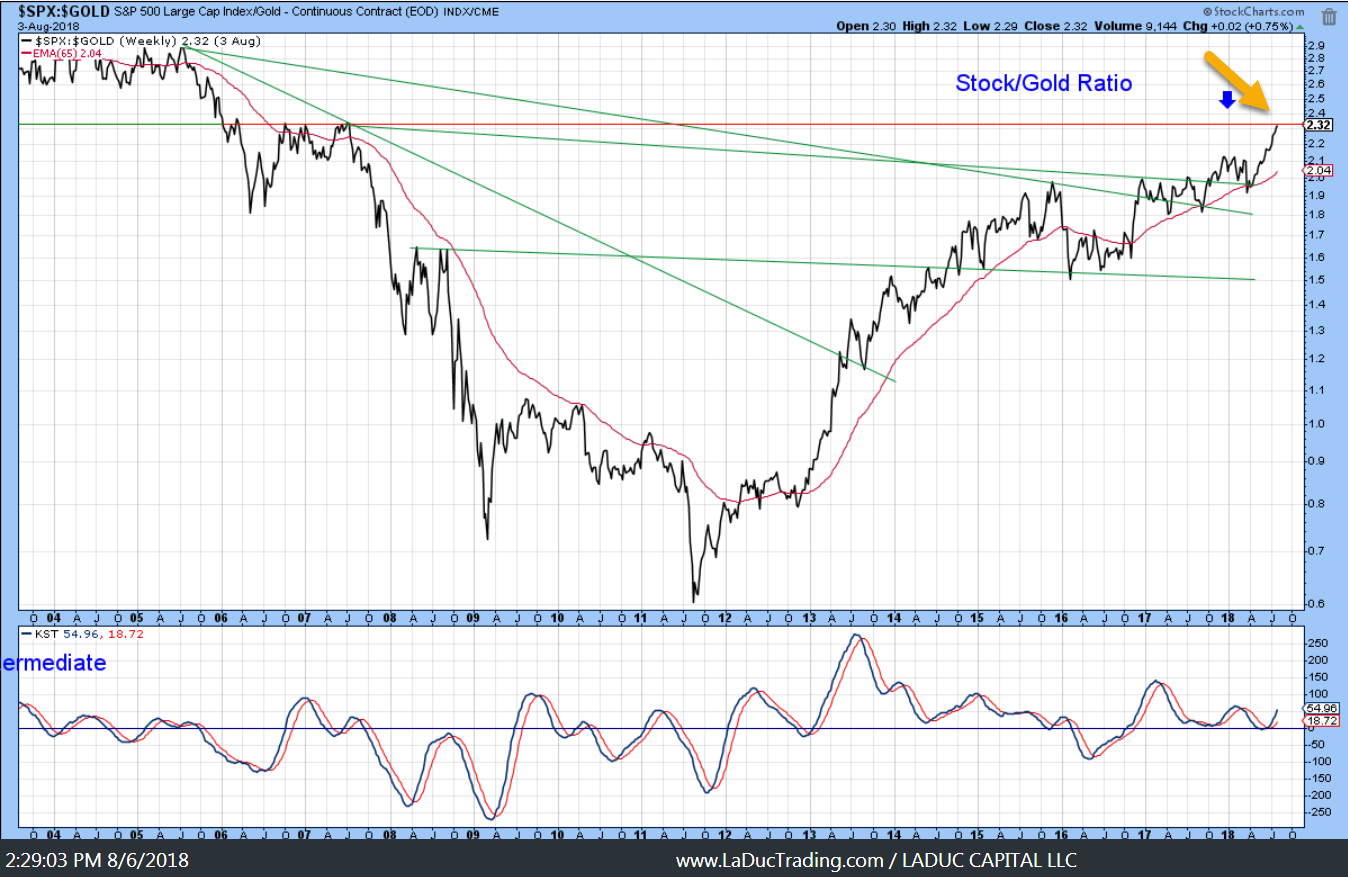
When is it Safe to Buy Gold?
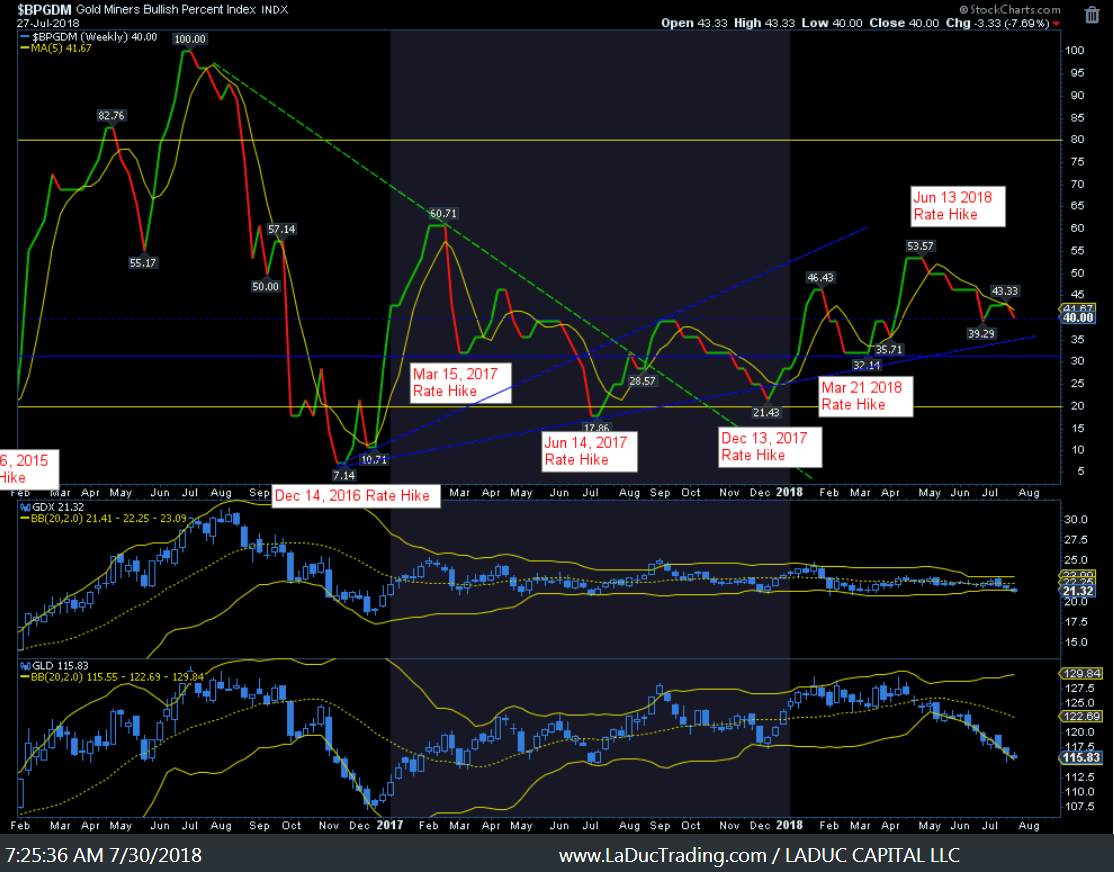
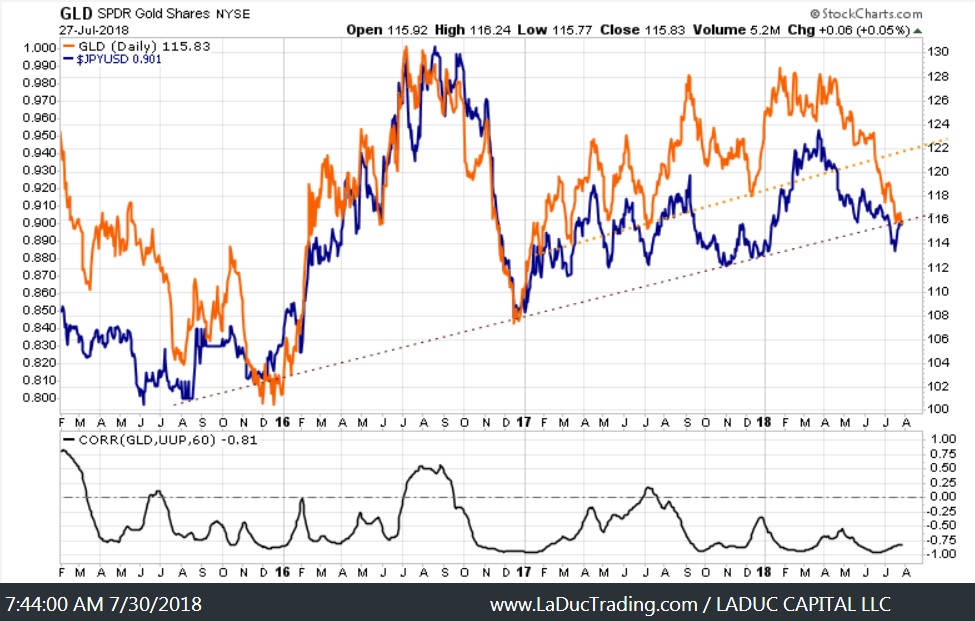
Gold and Miners may frustrate until September when the Fed is expected to raise rates (which has been bullish gold and miners past 7 rate hikes).The bigger issue is China. By design or by default, Yuan drives Gold. China has taken control of the gold market
“Since the PBOC began to actively devalue the yuan versus the dollar four weeks ago, the price of COMEX gold has tracked the yuan nearly tick-for tick.”
@Tfmetals
We can also point to record US Treasury shorts as well as massive Gold and Silver COT positioning short:
COT report July 27). Large spec. gold futures short contracts up another 11.4K over past week. 136% increase (+99K contracts to 172K) in just 6 weeks to highest level in at least 11 yrs (likely a record). Well above level at late-2015 gold low before huge up move. @htsfhickey
We also have weak seasonality for precious metals in summer. We need Macro – out of China and BOJ – to drive the Micro on Gold since Fed is not raising until September, about the same time China is working to monetize its Yuan-denominated Oil contracts backed by Gold. It’s not that Gold is out of favor everywhere – Russia and China continue to stockpile Gold in anticipation of the USD losing its World Reserve Currency status down the road.
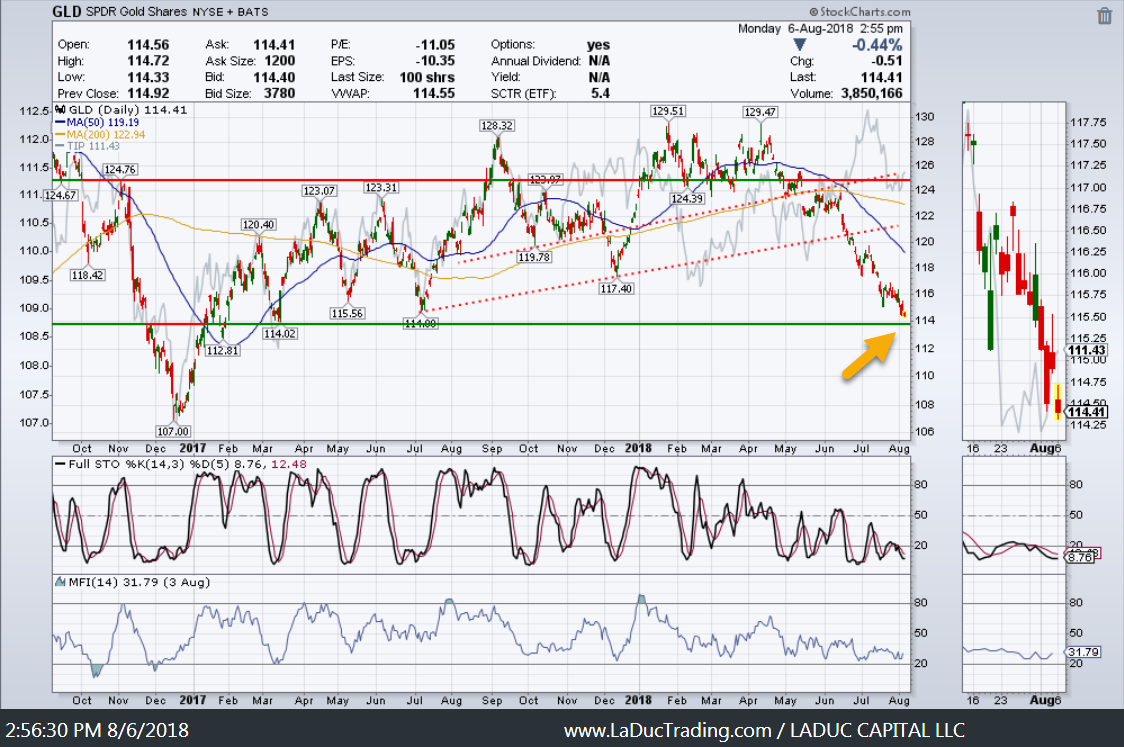
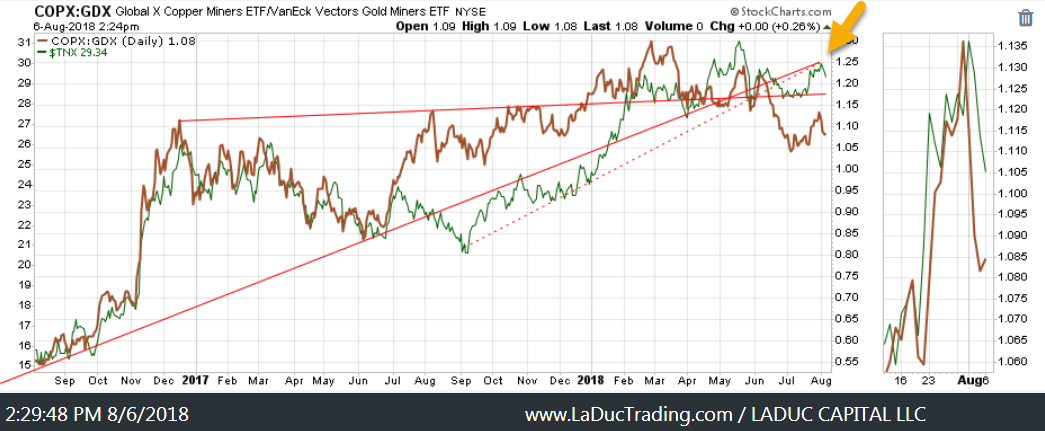
For now, I’m just looking for a safe, tradable bottom. Given all of these macro, intermarket and sentiment reads – not even addressing the fundamental case here – I have reverted strongly to this chart as a Tell for when to cover shorts and safely go long gold, silver and miners. And it says “Almost There!”
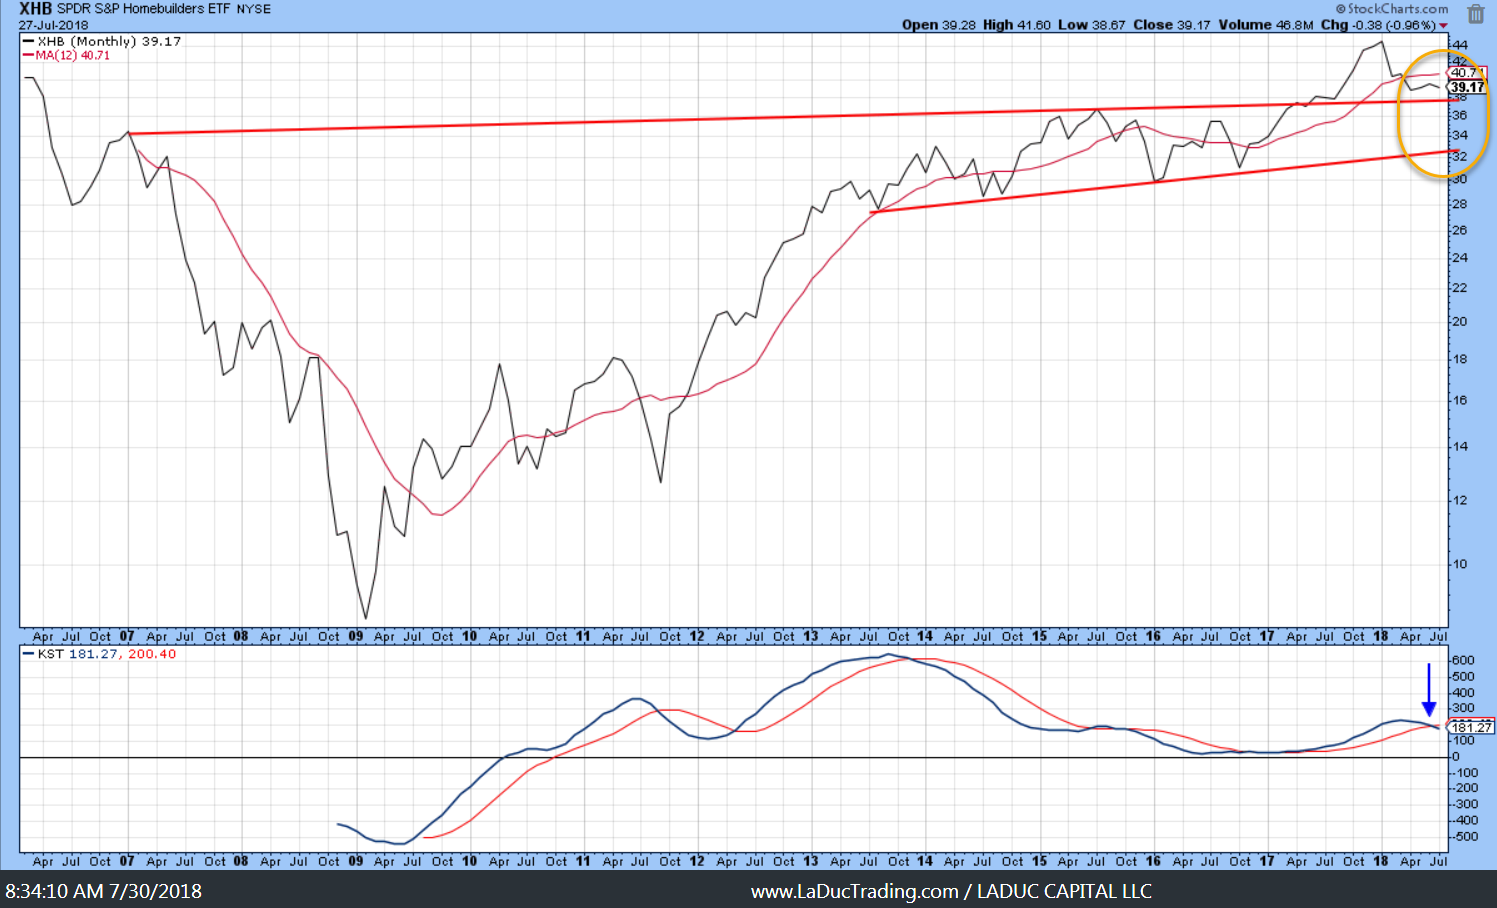
Pullback or Paranoia?
I’m worried about Housing, and the greater economic impact of slowing housing. For one thing, as homebuilding material costs keep rising (and they are – see LUMBER prices, along with interest rates and higher USD weakening buying power), new home construction price increases can stifle demand while borrowing costs can stifle loan supply.
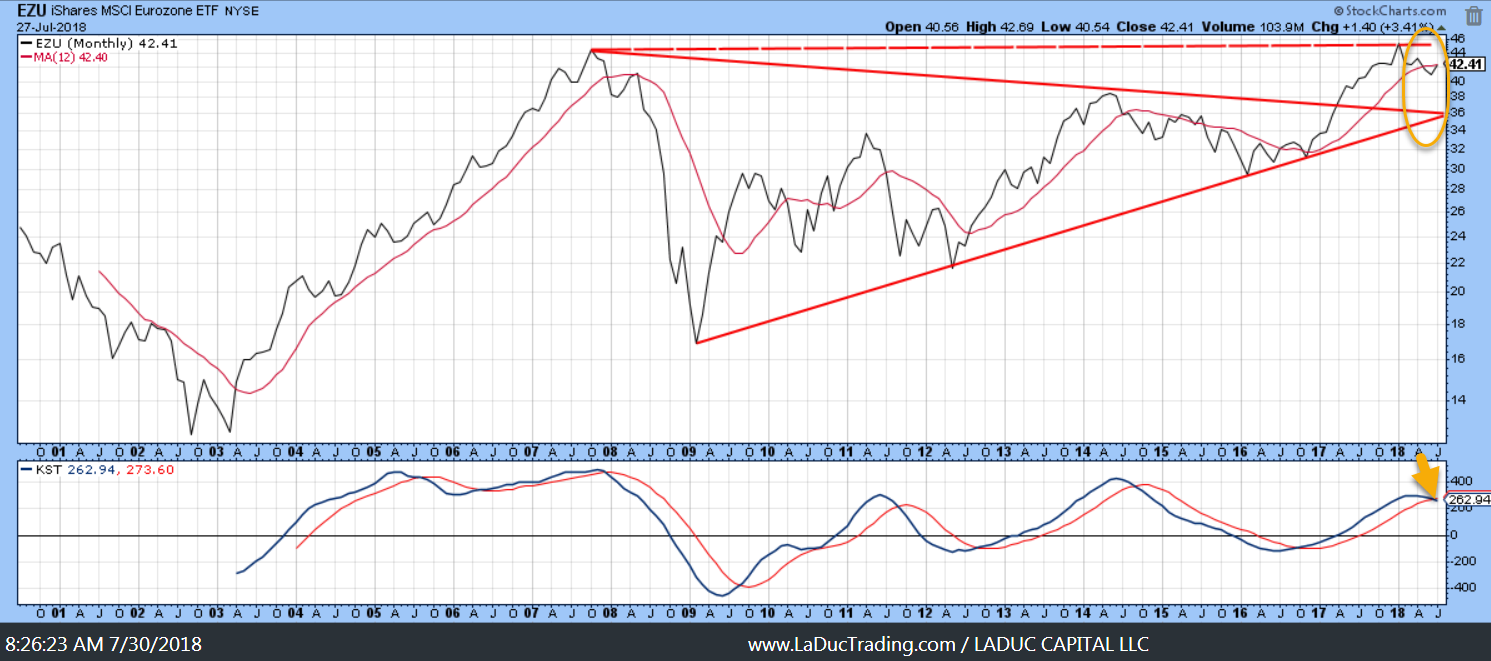
I’m keeping the other eye on the Eurozone as growth there is slowing as well, and with that potential spill-over to US markets.
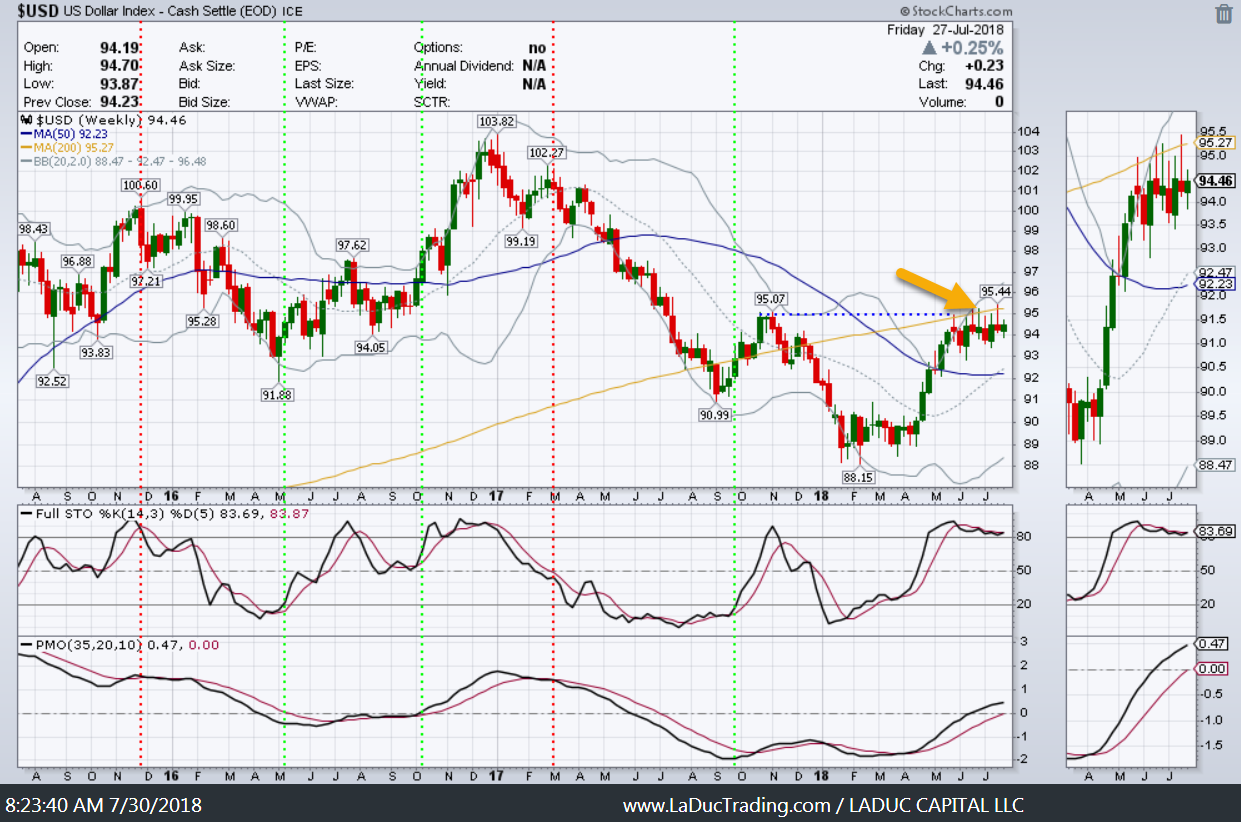
How Much Longer Before the US Dollar Moves?
US Dollar Watch is ON above $95, but it hasn’t closed there yet. If/When it does, then US Tech and equities heavily leveraged in USD-denominated debt, will be in a tight spot. Another risk group are those holding emerging market debt in USD, as there is a scarcity of DXY and higher USD would likely correspond to higher rates and both would cause markets across the world to pullback.
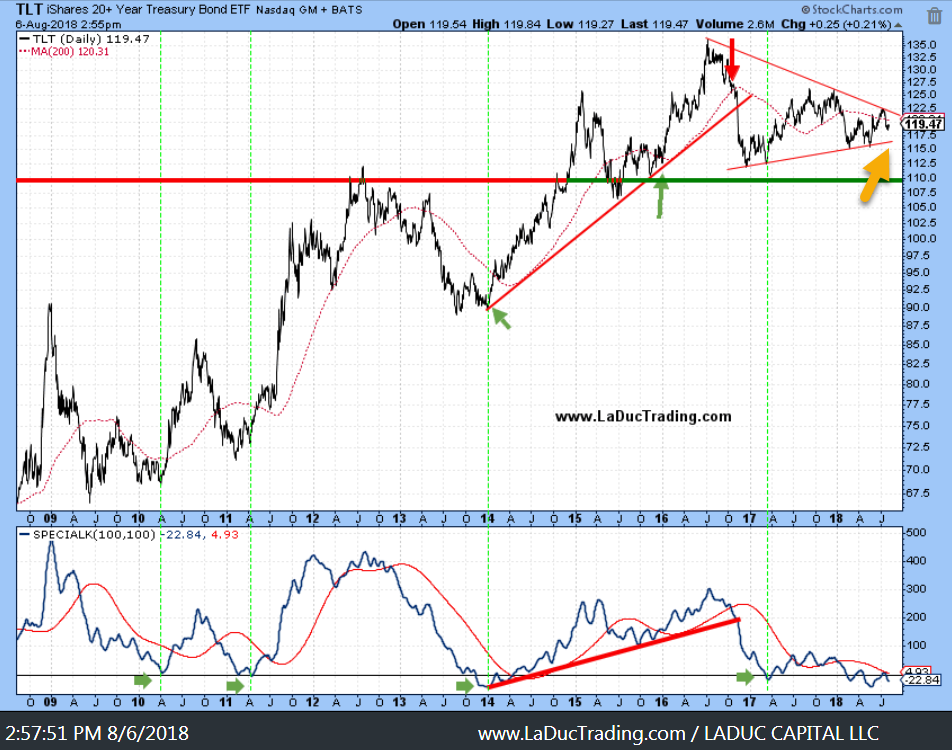
Rate Spike, Did Anyone Call a Rate Spike?
Since July 13th when I called it, we have experienced a sudden and impactful Rate Spike. This call was based on a chart read of not only technical support for TNX (10 year Treasury yield) but corresponded inversely with my TLT touch of the upper wedge with likely breakdown into trendline support around $116. We are still working our way down there. I will also be watching ~$114/112 for a TLT overshoot, as sometimes that is necessary so it can build the energy to reverse higher and break-out of the triangle – causing yields to fall.
The record short in Treasuries may help TLT propel to all time highs as well, but we aren’t there yet.
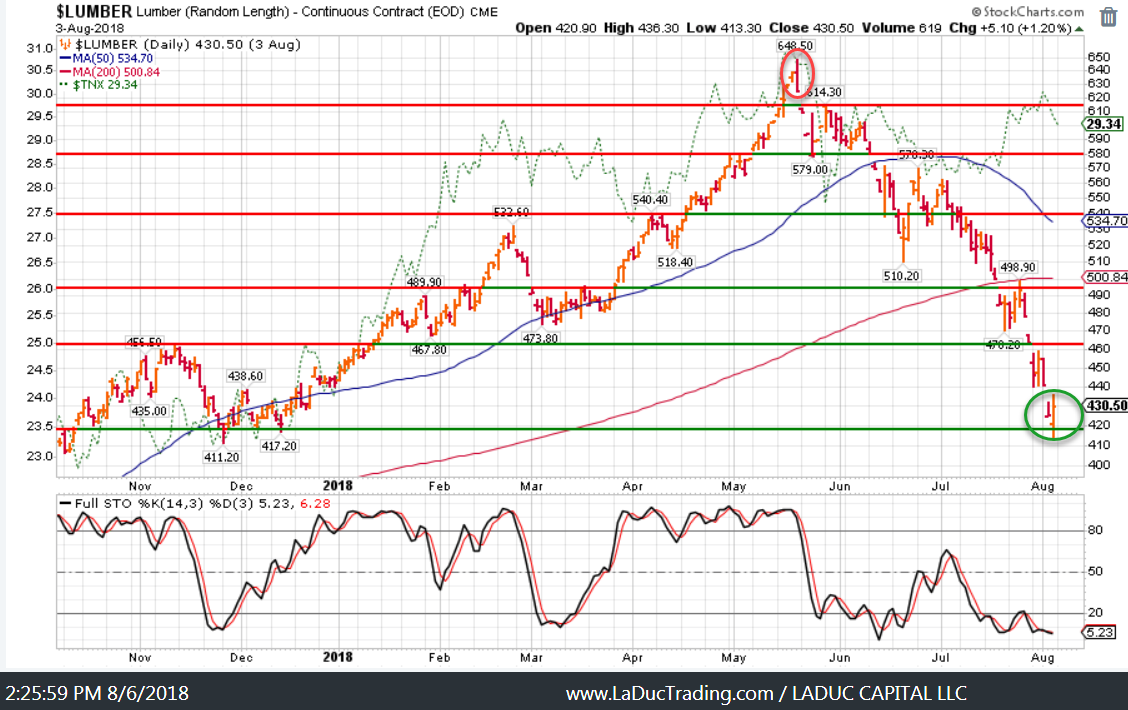
Rates and Commodities travel together for the most part:
And why am I including a chart of LUMBER with my rate spike section? Because Yields and Lumber are correlated and I find the current divergence, and oversold nature of lumber (along with the bullish engulfing candle on support), is cause for a potential bounce in lumber to coincide with a spike in rates. It would also help me justify my short TLT call above.
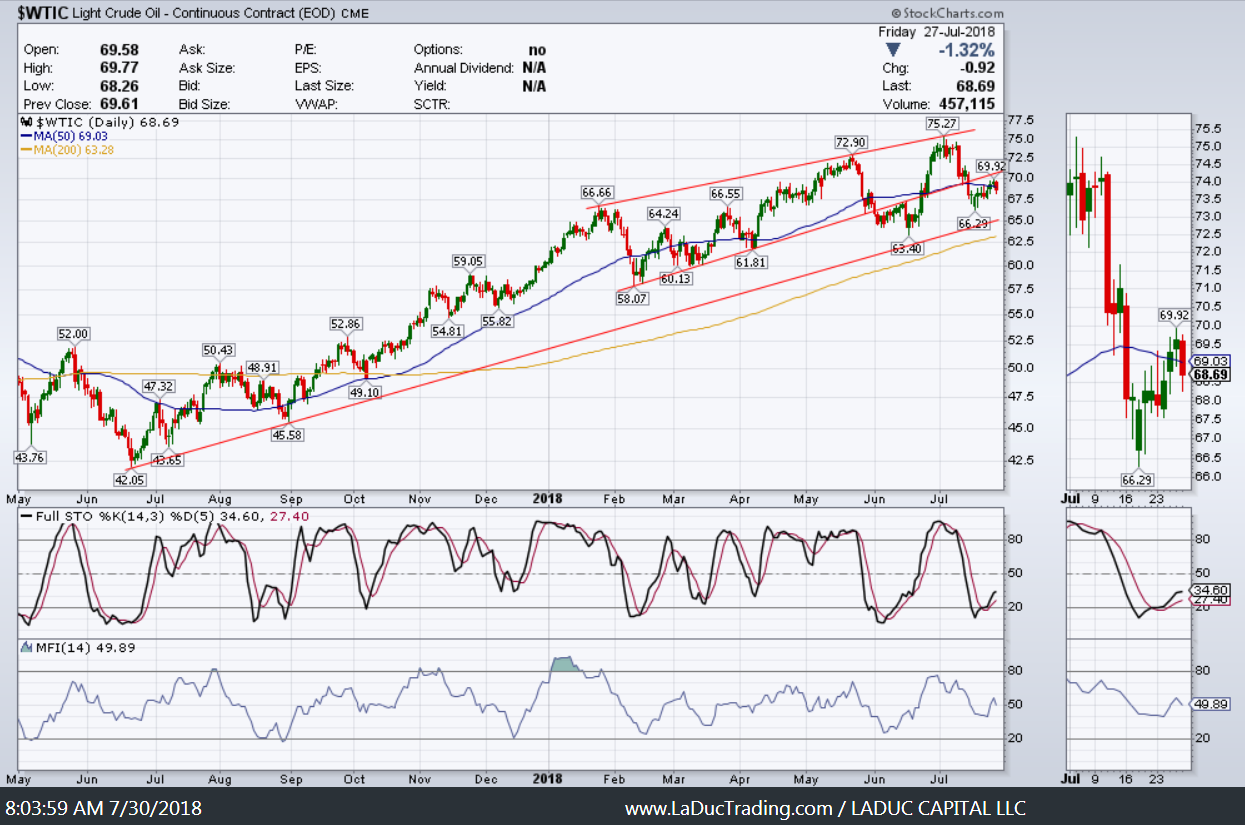
Elusive Oil
Supply and Demand are debatable. Headline risk from Iran Sanctions or Mid-Term Elections are real. The Crude Oil Trade has been choppy at best, so I am trying to simplify here when I say: Above $70 is bullish (inside channel) Below $70 (outside channel) is not – and likely targets $65, maybe 200D at $62.50.
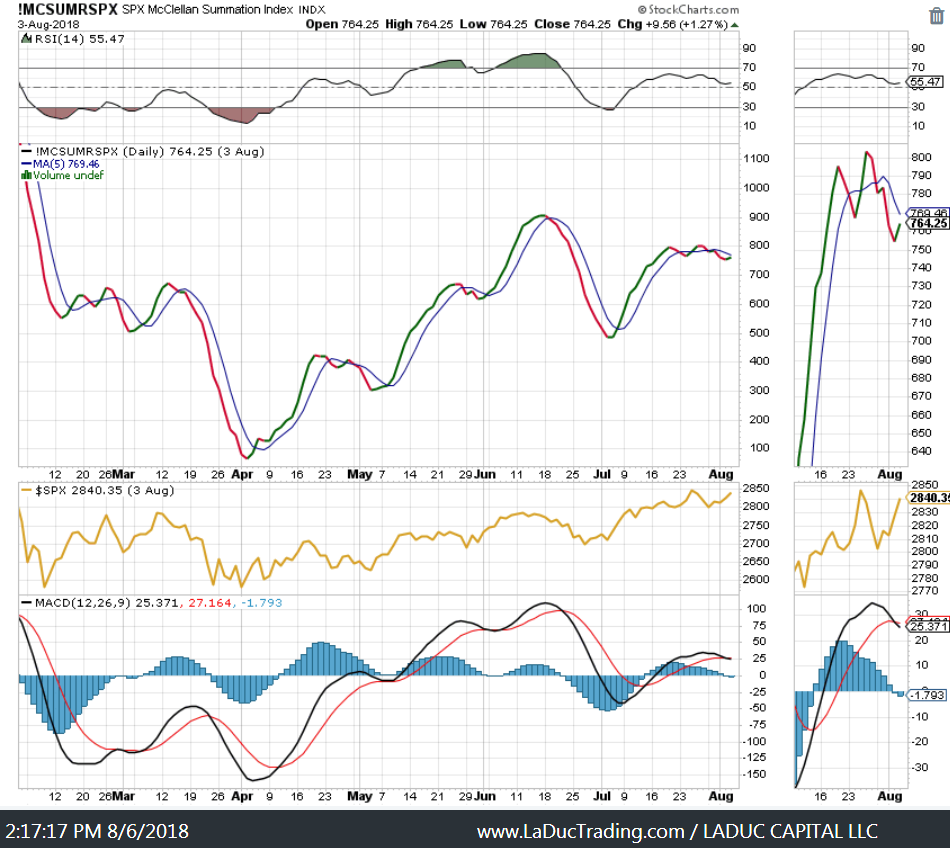
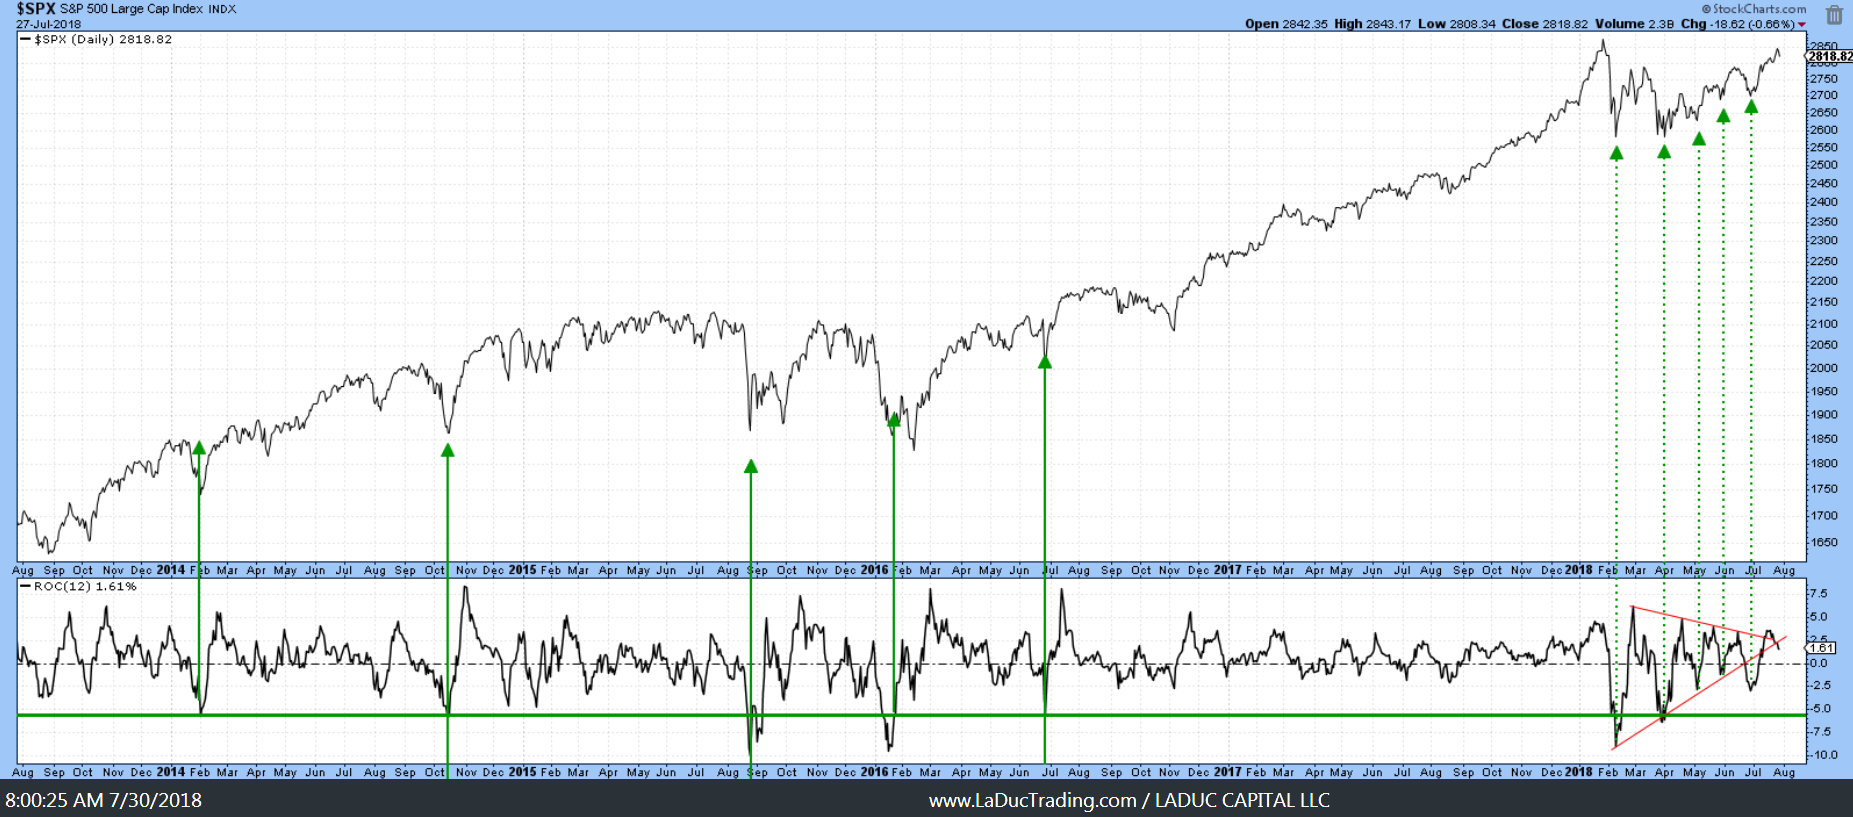
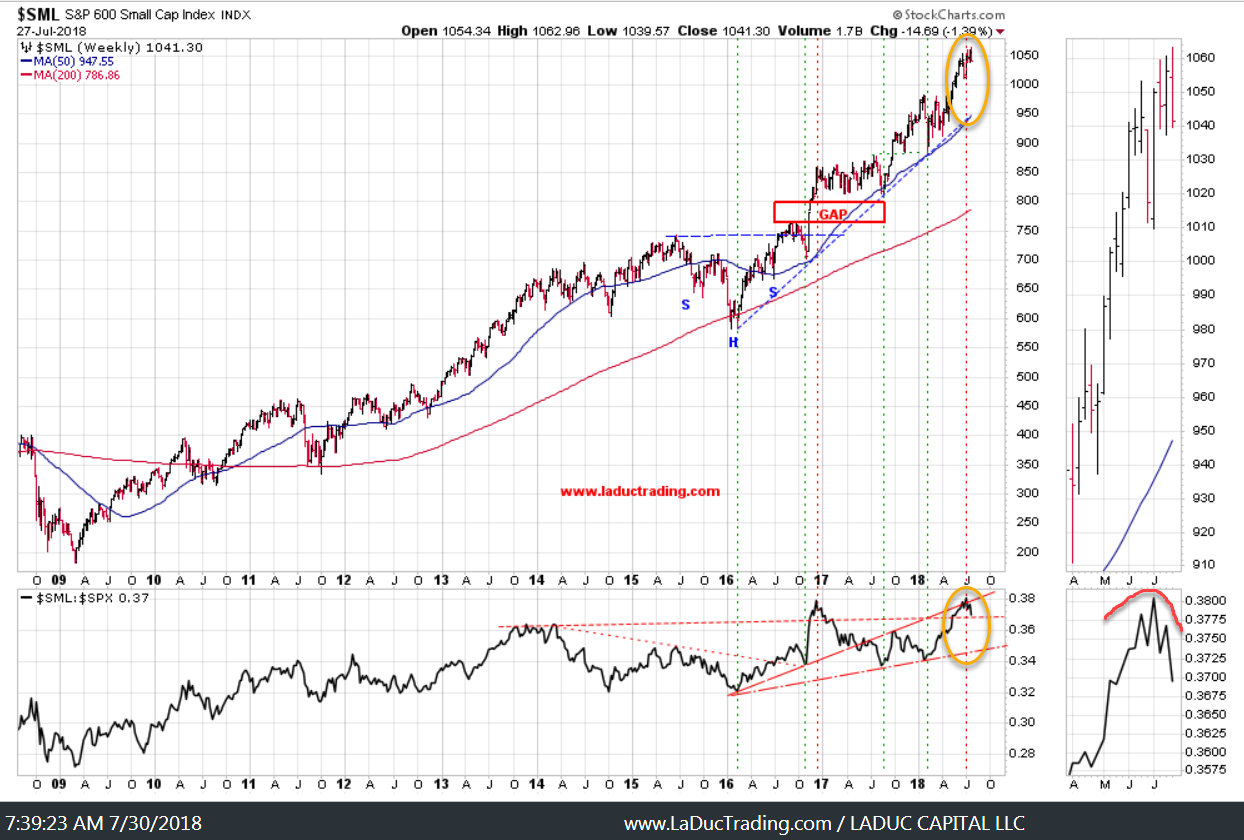
Intermarket Tells Don’t Match the Indices
These following charts are mainstays in my intermarket (breadth) analysis arsenal – charts I have come to rely on for many years – and they all shout CAREFUL, but the indices don’t hear them.
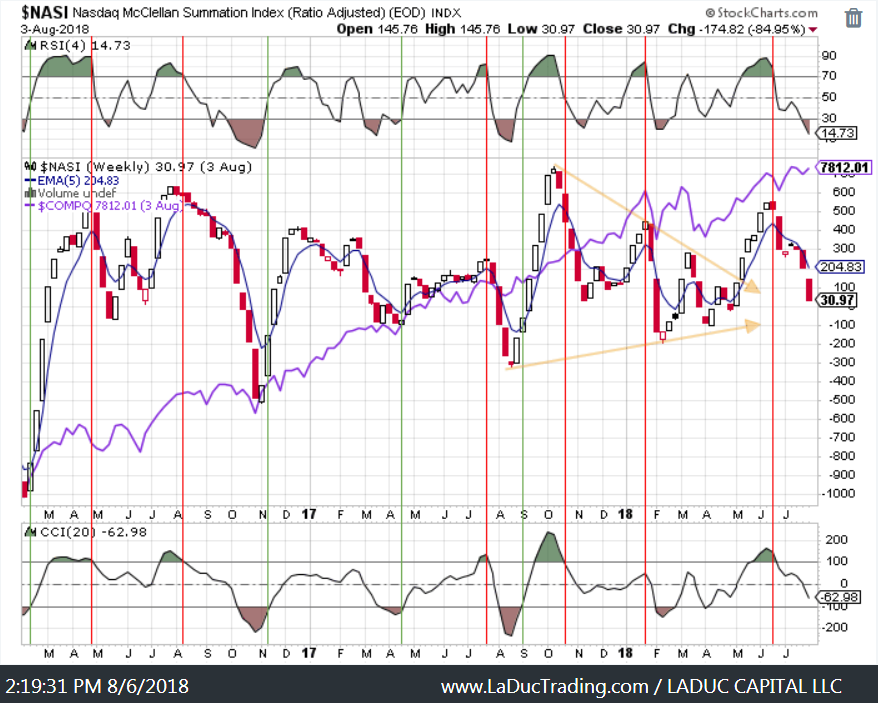
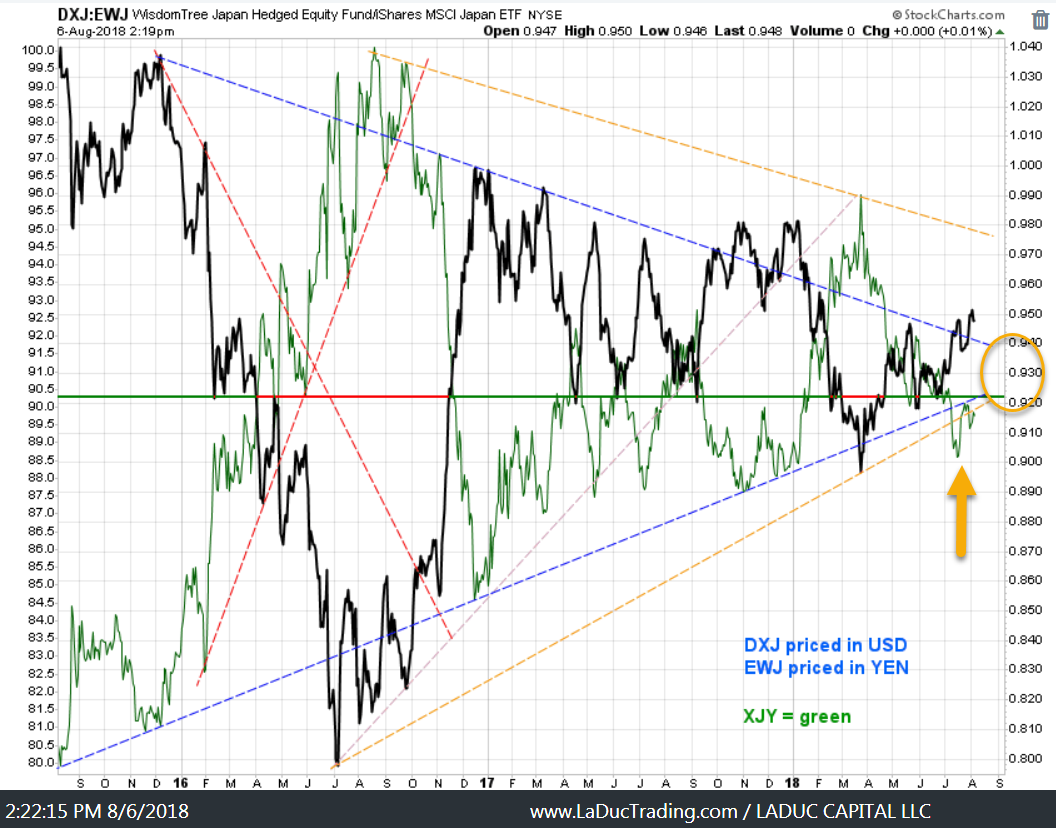
Japan Makes the Weather
The latest decision by the BOJ to raise the cap on the 10-year bond yield from 10bps to 20bps is stealth tightening and may be the trigger in future global bond yields. Even if you don’t trade bonds, watch this space. Currency and Rates cause Volatility and Volatility Reprices Everything.
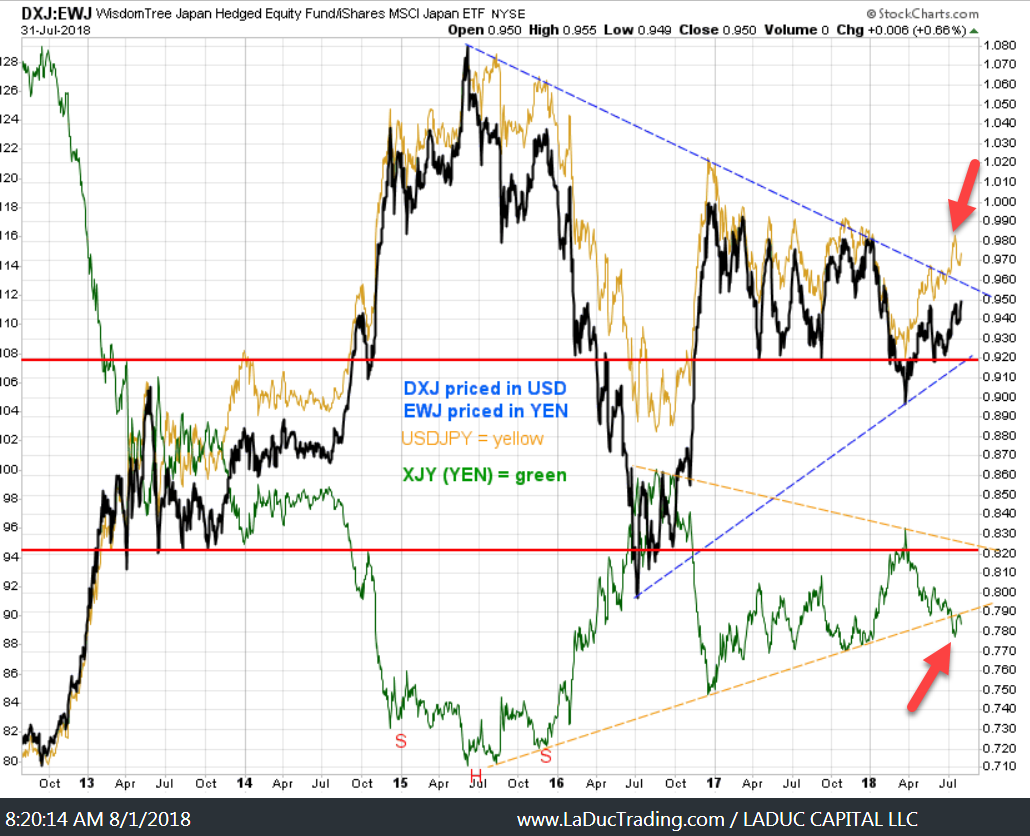
These ‘extrusions’ (highlighted above by the red arrows) are called Overshoots if they reverse…Breaks if they continue. Either way, what is happening with Japan Monetary Policy just isn’t normal AND whatever happens to Japan happens to Rest of World – especially if their JPB yield spike causes global yields to follow. The Dollar-Yen carry trade (USD/JPY) has added much liquidity for our markets, fought some of our currency battles with China devaluing their Yuan and generally kept a bid in their stock market (Nikkei, Topix) which fuels world growth/consumerism/leverage/treasury buying and so forth. If this changes, subtlety or not so subtlety, then US asset classes will be impacted..
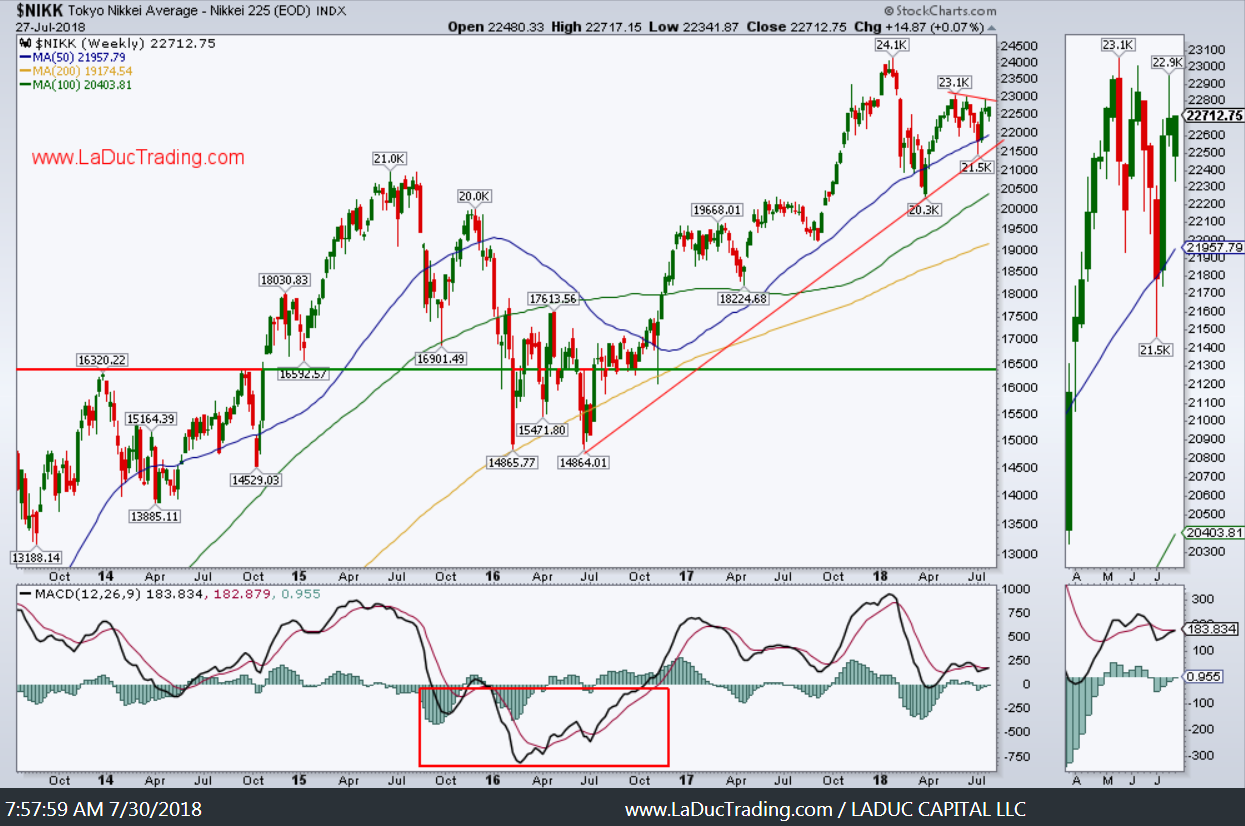
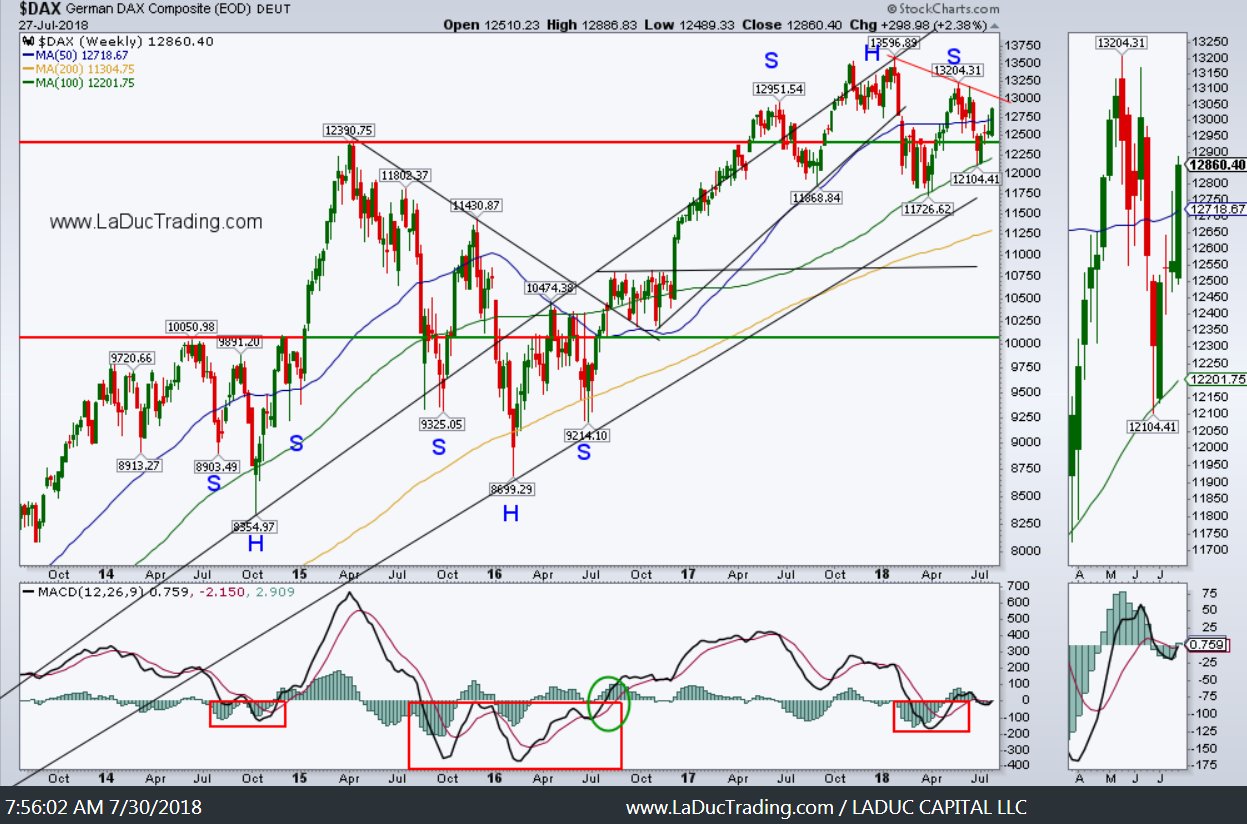
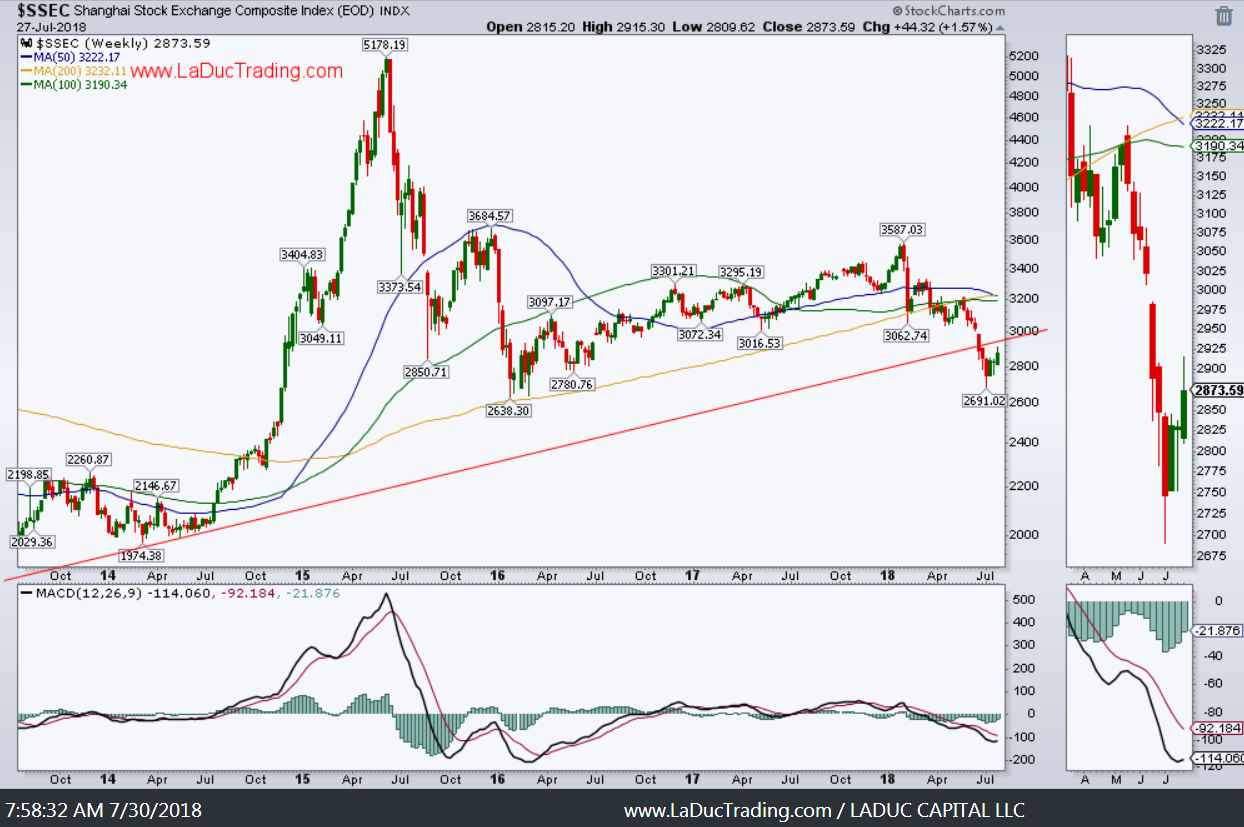
Global Perspective: Bounce or Trounce?
Presented without comment:
Thanks for reading and please consider joining me in the LIVE Trading Room where we work through Value and Momentum trade ideas and set ups every trading day.
At LaDucTrading, Samantha LaDuc leads the analysis, education and trading services. She analyzes price patterns and inter-market relationships across stocks, commodities, currencies and interest rates; develops macro investment themes to identify tactical trading opportunities; and employs strategic technical analysis to deliver high conviction stock, sector and market calls. Through LIVE portfolio-tracking, across multiple time-frames, we offer real-time Trade Alerts via SMS/email that frame the Thesis, Triggers, Time Frames, Trade Set-ups and Option Tactics. Samantha excels in chart pattern recognition, volatility insight with some big-picture macro perspective thrown in.
More Macro: @SamanthaLaDuc Macro-to-Micro: @LaDucTrading